Charting mulitple fields per group

I need to show a chart with data from multiple fields. Data should be grouped by census tract. Each tract has data for various health conditions. I would like a bar chart showing bars for each category for all selected census tracts. Is this possible?
For example: 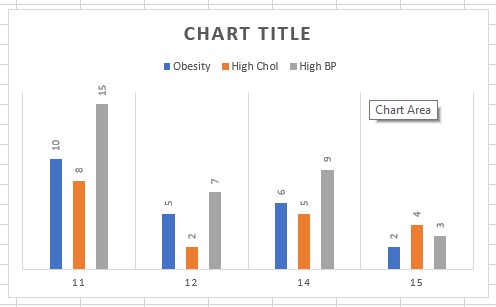
1
Du måste logga in om du vill lämna en kommentar.
Kommentarer
0 kommentarer