Highlight features in saved results because only 50 pins display

Happy Friday,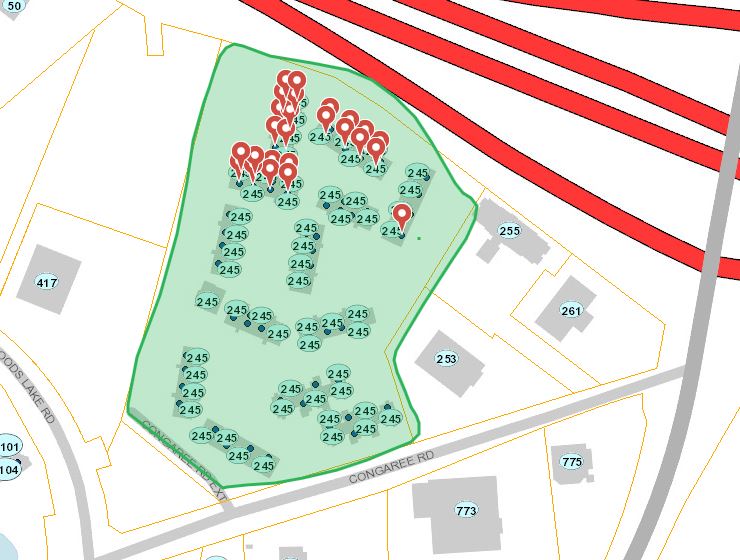
I hope this is an "it's late on Friday and I am missing something obvious".
Example below... I have selected/identified all the addresses at 245 Congaree Road using both 1) a workflow and 2) the identify by drawing a rectangle tool. (works the same either way)
About 210 addresses are selected and displayed in the results panel. I save the results and give it a name.
Then, I try to "Open the Saved Results" from the Results Panel Actions list. I see only the pins for the first 50 addresses. Yes, I can cycle through the next 50 using the keys below the results list. However, this doesn't give the user a way to visualize the spatial range/coverage of the entire selection.
Is there a way to make the Save Results either show all pins or at least somehow highlight all results at once via some configuration I am missing? (I know something can be achievable with workflows but trying to avoid).
Thanks,
Carmen
0
-

Carmen,
Yes, I also don't like the 50 pushpins. I went into the json file and changed pagesize from 50 to 500 (in 2 places), and it works better now. No noticable performance hit.0 -
Thank you Mike. I will definitely try your suggestion. Especially if there is not a way to also have all selected features at least highlighted as well with the saved results.
Thanks,
Carmen0 -
Hi Carmen,
Have you find out the way to make all selected features highlighted?
i can't even see the pushpins showing on my map when I open saved the results, it only shows at list view or table view. Where did you set it up?
Thank you0 -
Well, not really for the "Open Saved Results". I gave up but did learn a bit about where settings were located. I am sort of hoping I can do more after the upgrade.
In looking at my notes, you can change the visibility of the pushpins in the desktop.json.js (and tablet if needed) file in a couple different locations. Here is where they are located in the .json file ...{ "moduleName": "Results", "moduleType": "geocortex.essentialsHtmlViewer.mapping.infrastructure.results.ResultsModule", "configuration": { "resultMappings": { "Identify": [ "RemovePushpins", "ShowResultsList", "SetCollectionOfInterest", "HighlightFeatureDefault" ], "MapTip": [ "ShowMapTipResults" ], "Workflow": [ "AddPushpins", "ShowResultsList", "SetCollectionOfInterest" ], "Search": [ "AddPushpins", "ShowResultsList", "SetCollectionOfInterest" ], "QueryBuilder": [ "AddPushpins", "ShowResultsList", "SetCollectionOfInterest" ], "Measurement": [ "ShowResultsList" ], "ClusterFeatures": [ "ShowMapTipResults", "SetCollectionOfInterest" ], "Coordinates": [], "Selection": [ "AddPushpins", "ShowResultsList", "SetCollectionOfInterest" ] },
I did find that if I wanted to add pushpins to identify that it worked best to leave "remove pushpins" but add "AddPushpins" just after it. Not sure if my note is still relevant with latest upgrades.
You WILL need to enable pushpins on the HTML Viewer in Essentials for pushpins to work at all. That is found when editing the Viewer: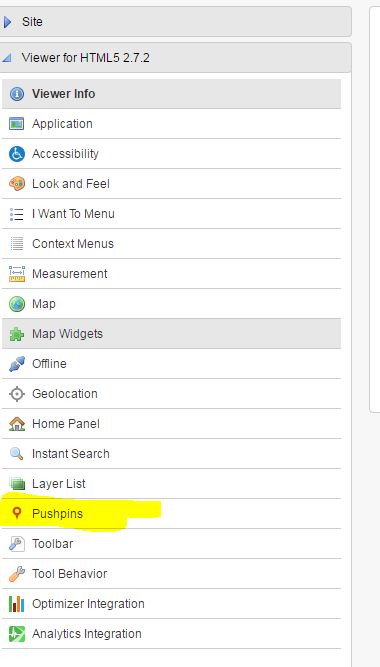
Hope this helps a little. If you wanted to change the pushpin number from 50 to more than 50, just search for "pagesize" in the .json file and you will find 2 instances of it.
Carmen0 -
Thank you Carmen. it helps.
Good news: highlight saved result feature is coming in the 2.8 release of the HTML5 Viewer.0 -
yes - we have upgraded and the option is in the Viewer within GE. Hooray! 0 -
I like the highlighting in the current version so much that I turned off Pushpins altogether... 0 -
I have to agree with you. Except for our cemetery viewer. I think the pushpin when hovering over the result record helps because everything is so close together. But I won't use pushpins for all selections. 0 -
Even in my cemetery viewer under construction, I've removed pushpins. The highlighting of points is done with a circle so can be easily seen when hovering over a result. Try searching for Fulkerson at the following site:
https://maps.srcity.org/Html5Viewer/Index.html?viewer=CemeteryViewer0 -
Yes, I may have to tinker with the new highlight color settings, too. I may be changing them in my workflows because at one time I had to. My workflow may be interfering with the new default. We've only upgraded our test server this week and we are running through our apps to test all the workflows and the new capabilities. Thanks for the link to test.
Who did all the research (ie. newspaper obituaries) to add additional information for each interment? It would be interesting to see, for example, how many of the 1918 burials were due to the flu epidemic. There were easily 50% more burials that year.
Carmen0 -
There were 50% more burials using our Cemetery App in Greenville, SC that is. 0 -
Here is a link to an article that describes the researchers. It was seeing this article and your site that made me want to build a cemetery viewer myself. They are putting this all into a book as well, that they sell to raise money for the cemetery. Because of that, they don't want me to publish the map yet - they think it would take money away, but I think it would help sell their book... Anyway, they were very good with data entry, and I made many fields searchable, including the notes - you can search for "earthquake" to see victims of the 1906 quake, or "flu" etc.
http://www.pressdemocrat.com/news/6290086-181/santa-rosa-rural-cemetery-researchers?artslide=00
Du måste logga in om du vill lämna en kommentar.
Kommentarer
12 kommentarer