chart series for multiple features
Hello,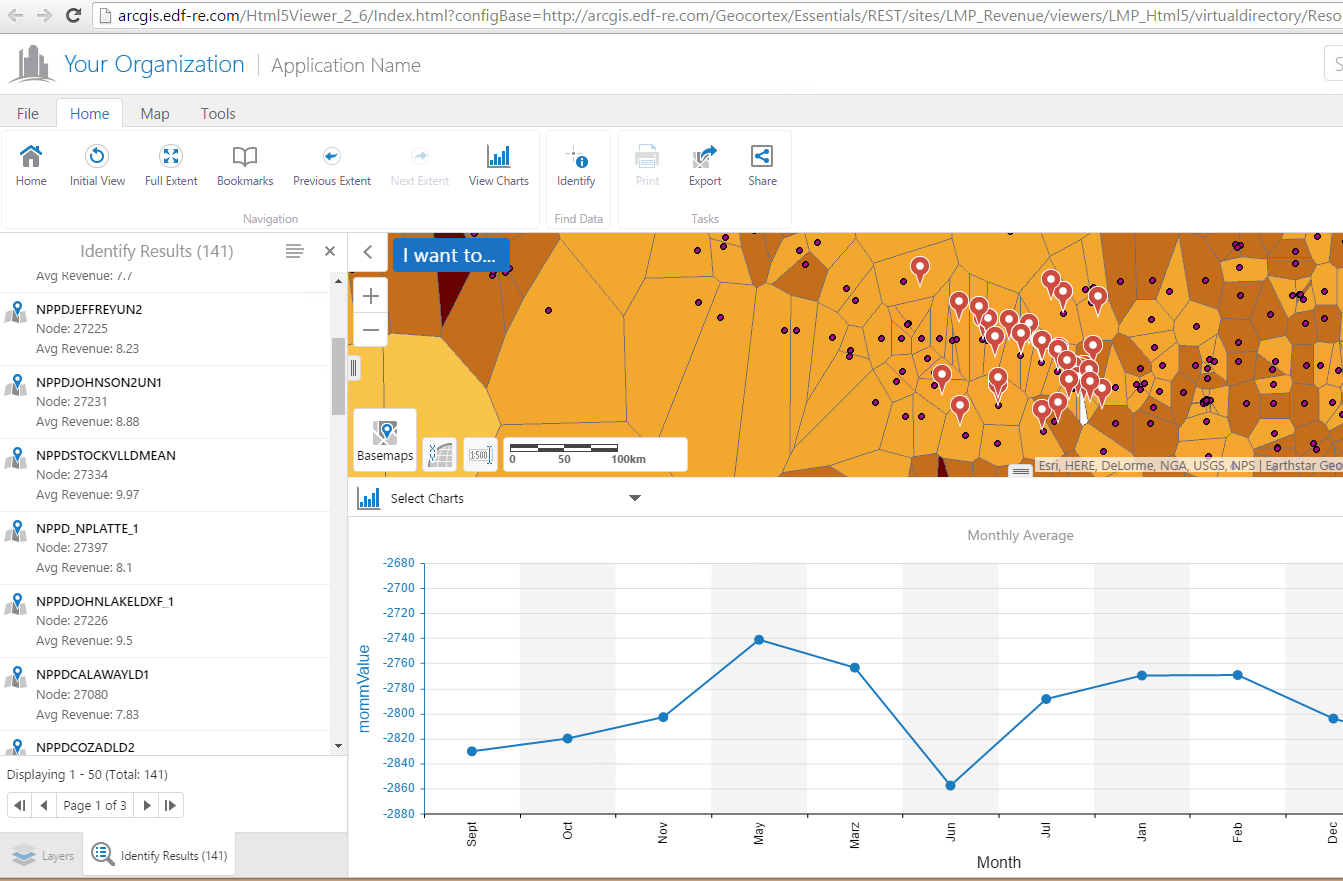
I have some points that have a value for each month associated to them. The idea is that if I select multiple features, I should be able to see the time series for each one of them in the same chart.
So, if I selected three points, then the graph would show the three individual time series in the same chart. So far, the chart shows only one time series that is the sum of the indivudal ones. Does someone know if it is possible to do this?
Also, the query for the months in the x axis returns the months names in order, but the chart change them. Is there a way to fix that?
Thanks.
0
-

Hi Jose-Luis,
Unfortunately, the way the charts are configured, it will always combine all your features and do a sum/count of each column. It will only show 2 or more lines if you have multiple series added to the chart in Essentials Manager, which means you can have the chart show information from 2 columns of the same feature; however, you cannot display 1 line per feature.
I hope this helps
Carmen0 -
Hi Carmen,
Is it still true that a chart can only show 1 feature or the aggregation (sum/average/etc.) of multiple features? We would like to show the values of multiple features on one chart - - to compare the values of 2+ locations.
Thanks,
Stephanie0
Du måste logga in om du vill lämna en kommentar.
Kommentarer
2 kommentarer