Edit Class Sizes in Custom Layer Visualization Options
Is there a way to edit the class sizes manually in the visualization options? I am filtering specific features that have low numbers in comparison to the rest of the dataset and the classifications don't show much change.
Using most recent versions of GE and HTML5.
Thanks
Krystal
0
-

Hi Krystal,
You should be able to manually set styles for the layer in Essentials Manager, writing an Esri renderer that has the exact class breaks you want. Then the end user can select the style that you've defined when they use the layer visualization in the viewer. I don't think it is possible in the HTML5 viewer for the end user to define the class break values themselves though; if this is a functionality you would like to see in the future please post it on the Ideas board so that other can vote for it as well.
As an example, here's a simple class breaks renderer that I tested with:{ "type":"classBreaks", "field":"ELEVATION", "minValue":200, "classBreakInfos":[ { "classMaxValue":250, "label":"200 to 250", "description":"200 to 250", "symbol":{ "type":"esriSMS", "style":"esriSMSCircle", "color":[ 255, 0, 0, 255 ], "size":5, "angle":0, "xoffset":0, "yoffset":0, "outline":{ "color":[ 0, 0, 0, 255 ], "width":1 } } }, { "classMaxValue":5000, "label":"250 to 5000", "description":"250 to 5000", "symbol":{ "type":"esriSMS", "style":"esriSMSCircle", "color":[ 255, 0, 0, 255 ], "size":10, "angle":0, "xoffset":0, "yoffset":0, "outline":{ "color":[ 0, 0, 0, 255 ], "width":1 } } } ] }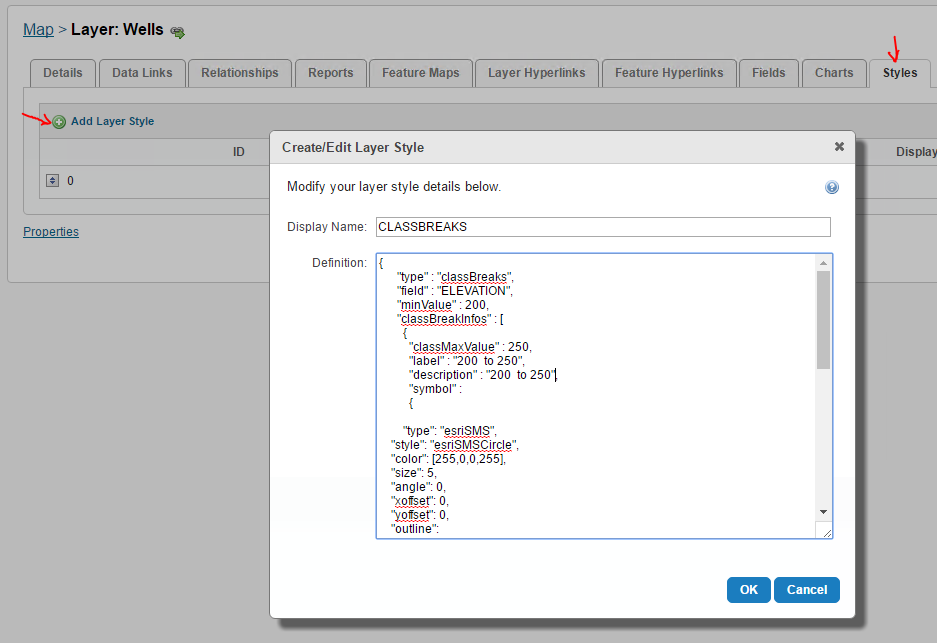
Hope that helps!
-Amanda0
Du måste logga in om du vill lämna en kommentar.
Kommentarer
1 kommentar