Heat map values with dates
I have a set of stations that release a substance which is measured on a daily level. I have an integer value and a sample date to work with. The date ranges over a year and the measured values fluctuate throughout that year.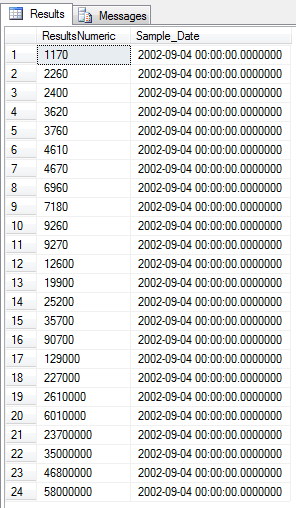
After I've enabled the feature heat map and use a low intensity setting, the only colour that appears is the highest density (Innermost Colour) and none of the lower measured values appear in the resultant heat map.
Sure, I'm seeing hot spots, but I cannot seem to show any other gradient measured value for either the high density (Inner Colour) or the low density (Outer Colour).
While looking at the image above, there should be a wide dispersion of all low-high colours in the output heat map, given that these values reflect a single day of sampling.
Looks pretty, but does it really show these measured values across an area using the three colour density values.
Walter
0
-

Hi Walter,
I believe that this was addressed in a support case, but in case anyone else stumbles on this post, the issue is that there is no way to set the min/max intensity values for heat maps. We are looking into adding this in a future versions of the product!
Thanks,
Danny0
Du måste logga in om du vill lämna en kommentar.
Kommentarer
1 kommentar