Don't show data link joins in additional details

I have a One to Many data link set up to a SQL table to use for charts in certain layers. The chart works great, but when people click 'view addtional details' in the map tips box it includes a list of every join that feature has made to the data link table, which can be hundreds. How can I stop it from displaying those joins while keeping the chart working? Bonus points, can the chart be moved up to above the details section, below the description?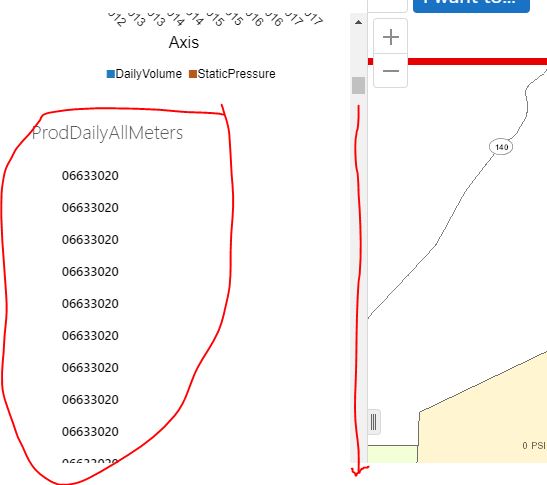
0
-

Hi Max,
I think we likely hadn't considered the use case that you may want to build charts from a data link, but without displaying the data the usual way as well. As things are now, there is a checkbox to make a data link not visible, but this also removes the ability to chart with the data. I would suggest posting an Idea (https://support.geocortex.com/GSCIdeas?c=09a6000000008RsAAI&filter=1&categ=all&sub-nav=ideas&main-nav=essentials&page=1) to request we provide configuration options to do this through Essentials Manager.
If you don't need to show any data other links at all in your viewer (except in chart data), then you could use the following css to hide the list of data link results from the feature details page:.FeatureDataLinksProviderView .panel-group { display:none; }(example location for your viewer's custom css file where you would paste this is C:\Program Files (x86)\Latitude Geographics\Geocortex Essentials\Default\REST Elements\Sites\SITENAME\Viewers\VIEWERNAME\VirtualDirectory\Resources\Styles\Custom\Desktop.css).
As for switching the order of the data in the Feature Details view (for bonis points!), it's a bit difficult, but you can try the following:- Navigate to the viewer's dekstop config file. The default location is: C:\Program Files (x86)\Latitude Geographics\Geocortex Essentials\Default\REST Elements\Sites\SITENAME\Viewers\VIEWERNAME\VirtualDirectory\Resources\Config\Default\Desktop.json.js
- Backup the file and edit the original in a text editor like Notepad
- Use CTRL + F to search for "moduleName": "FeatureDetails"
- Scroll down to find the "providers": [] section, ~30 lines later
- The sections from the feature details are listed here, in the order that the appear in the viewer. Each one is each within its own {} braces
- The one for charts will look something like this
{ "type": "geocortex.essentialsHtmlViewer.mapping.modules.charting.SingleFeatureChartViewModel", "viewId": "FeatureChartsProviderView", "viewType": "geocortex.essentialsHtmlViewer.mapping.modules.charting.SingleFeatureChartView", "libraryId": "Mapping.Charting", "iconUri": "Resources/Images/Icons/charting-24.png", "markup": "Mapping.Charting/modules/Charting/SingleFeatureChartView.html", "title": "@language-feature-charts", "config": { "infrastructureLibraryId": "Charting", "containerRegionName": "SingleFeatureChartsRegion", "chartConfiguration": { "animationsEnabled": true, "gradientsEnabled": false, "interactiveLegendEnabled": false, "pieStartAngle": 180, "renderAs": "svg" } } }, - You can move this whole charts item to just after the feature description item, which will look something like this:
{ "type": "geocortex.essentialsHtmlViewer.mapping.modules.FeatureDetails.FeatureDetailsProviders.DescriptionViewModel", "viewId": "FeatureDescriptionProviderView", "viewType": "geocortex.essentialsHtmlViewer.mapping.modules.FeatureDetails.FeatureDetailsProviders.DescriptionView", "title": "@language-feature-description", "markup": "Mapping/modules/FeatureDetails/FeatureDetailsProviders/DescriptionView.html", "config": { "longDescription": true }, "enabled": true }, - Save the file and test the viewer
- Repeat for Tablet.json.js and Handheld.json.js if necessary
Hope that helps!
-Amanda0 -
Amanda,
Both of those suggestions worked perfectly! That is the only data link I use so I'm not sure what would happen if there were others, but in my case it's great. I chose to use a data link for the charts because it is a very large table that is updated hourly on a SQL server. By using a data link I can leave it in it's native location, and the users can see a graph with up to the hour info by simply clicking on dot they are already used to.
Thanks again0 -
An odd thing I'm noticing, but was also happening before these changes, is that after I view several features and the chart associated with them, the whole webpage sometimes becomes unresponsive. When I clcik on 'view addition details' the side bar opens like normal but right beofre the chart loads everything freezes and chrome gives a page unresponsive warning, in IE it just freezes. It happens after you view about 5 or 6 charts in a row. The only thing I see in ArcGIS server manager is an warning saying 'Failed to log in. Invalid username or password specified.' Any ideas on that? Reloading the map fixes it, but then it just happens again. 0 -
Hi Amanda,
I am on 4.9.0.60 and am having an issue. I thought this was working in earlier versions, but I only want to show one datalink at the bottom of the detials panel, and not the other. However i want to use the data in the feature description as well. How can i make it not visible in the bottom of the detials panel but still use reference data in the popups if the datalink visibility is "Unchecked"
Thank you
AC0 -
Hi Adam,
I would recommend posting to the Ideas section (https://support.geocortex.com/GSCIdeas?c=09a6000000008RsAAI&filter=1&categ=all&sub-nav=ideas&main-nav=essentials&page=1) . If the visible checkbox is unchecked, the viewer doesn't get the data at all from the data link, so you can't use it in the feature description.
We can still get a css to hide a data link that contains a particular display name, but be aware that this requires your data link's display name to be unique. The tag that holds a data link looks something like this if your data link is called MyDataLinkName:<div class="view FeatureDataLinksProviderView datalink-MyDataLinkName-hkGDJJEe-compact active">The hkGDJJEe part is randomly generated, so we would have to use a selector that finds anything with "datalink-MyDataLinkName" in it. This css worked for me:.FeatureDataLinksProviderView[class*=datalink-MyDataLinkName] { display:none; }
Max, your issue sounds likely to be a bug, I would suggest contacting support for that.
Hope that helps!
-Amanda0 -
Hi Amanda,
Thank you for the update. Was hoping to still access the data without having to display it after my custom feature descriptions.
I also noted that the data from the datalinks are still accessible to the reports, even if it is not 'Visible'. Seems like that functionality would be useful inside the viewer as well.
Thanks again for your suggestions.
AC0 -
Hi Amanda,
I tried to add the following code to the CSS file, however it does not seem to be working. The name of the data link is Zoning.
There are a couple datalinks called zoing, but all on different layers, would this cause an issue?
.FeatureDataLinksProviderView[class*=datalink-Zoning] { display:none; }0 -
Amanda - I have tried adding the following snippit to the desktop.css file (I am accessing it from C:\Program Files (x86)\Latitude Geographics\Geocortex Essentials\Default\REST Elements\Sites\SITENAME\Viewers\VIEWERNAME\VirtualDirectory\Resources\Styles\Custom\Desktop.css), but it is not removing the data links information from the "View Additional Resources" pannel. Do you have any thoughts on what I might be missing? Thanks. .FeatureDataLinksProviderView .panel-group { display:none; }0
Du måste logga in om du vill lämna en kommentar.
Kommentarer
8 kommentarer