Chart does not get data from Workflow in Studio Web
Répondu
I am trying to visualize the results from a workflow (features from a query) as a chart in Viewer 5. The user is supposed to filter data via a display form, the workflow then makes a query and the results are supposed to be shown as a chart. Even though I have included the charts.display command the chart does not show up after executing the workflow, even though the right features are selected and shown as a result. I don’t get an error in the workflow either. I have already tried to:
- select features with the identify tool and run the chart from there, which works, so I guess the chart is configured correctly
- Change to source of the chart to workflow / visible layer, which both does not work.
- Include charts.display command in workflow and viewer5
Is there anything I am missing out on to view data from a workflow as a chart?
-

Hi Lea,
I'd recommend also including the ui.activate command after the charts.display command and supplying the chart VSW component id as a Parameter.
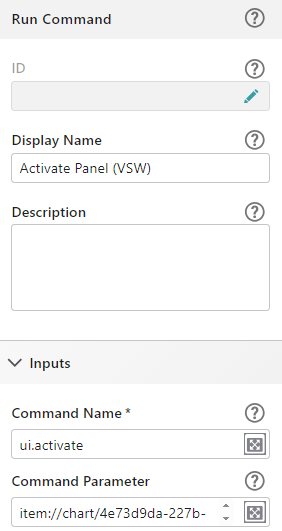
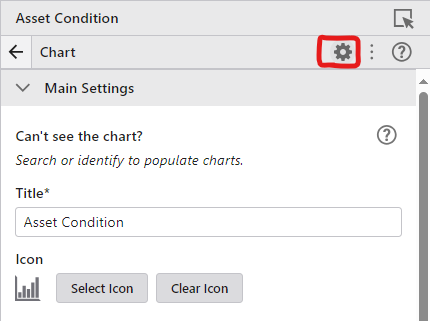
You can get that ID by clicking on the "Settings" icon in the Chart Component in VertiGIS Studio Web.
If that doesn't work, you'll need to make sure that you are passing VertiGIS Features (rather than Esri Features which are returned from the Query Layer Workflow activity) to the charts.display command from your workflow. You can accomplish that using the results.from-graphics operation. Alternatively, there is also a tasks.query operation that you can use instead of the Query Layer activity that will automatically return VertiGIS Features that can be used as input for the charts.display command.Lastly, if you are using the Query Layer activity, you need to make sure you are supplying the Layer or Sublayer as input (rather than a URL) as Web uses that to determine the layers source and any charts associated with that layer. You can do that by using the "Get Layer" activity before running your query.
Hope that helps!4 -
Hi Patrick Fingler
thanks for your response. Could you please provide me some examples how you would structure the workflow with the results.from-graphics/tasks.query operation and which parameters you would use? I am working in Version 5.24
0 -

Thanks for dropping in with some awesome guidance there, Patrick!
Lea Dulisch there's a great example of workflow structure in our VSW sample app's provided workflows, we have a Demographics workflow that queries a selection of neighbourhoods and provides some charts based on the associated demographics.
A few links on that:
- Studio Web developer docs on API operations (have a look at results.from-graphics specifically)
- VSW Chart docs
It looks like this in action:
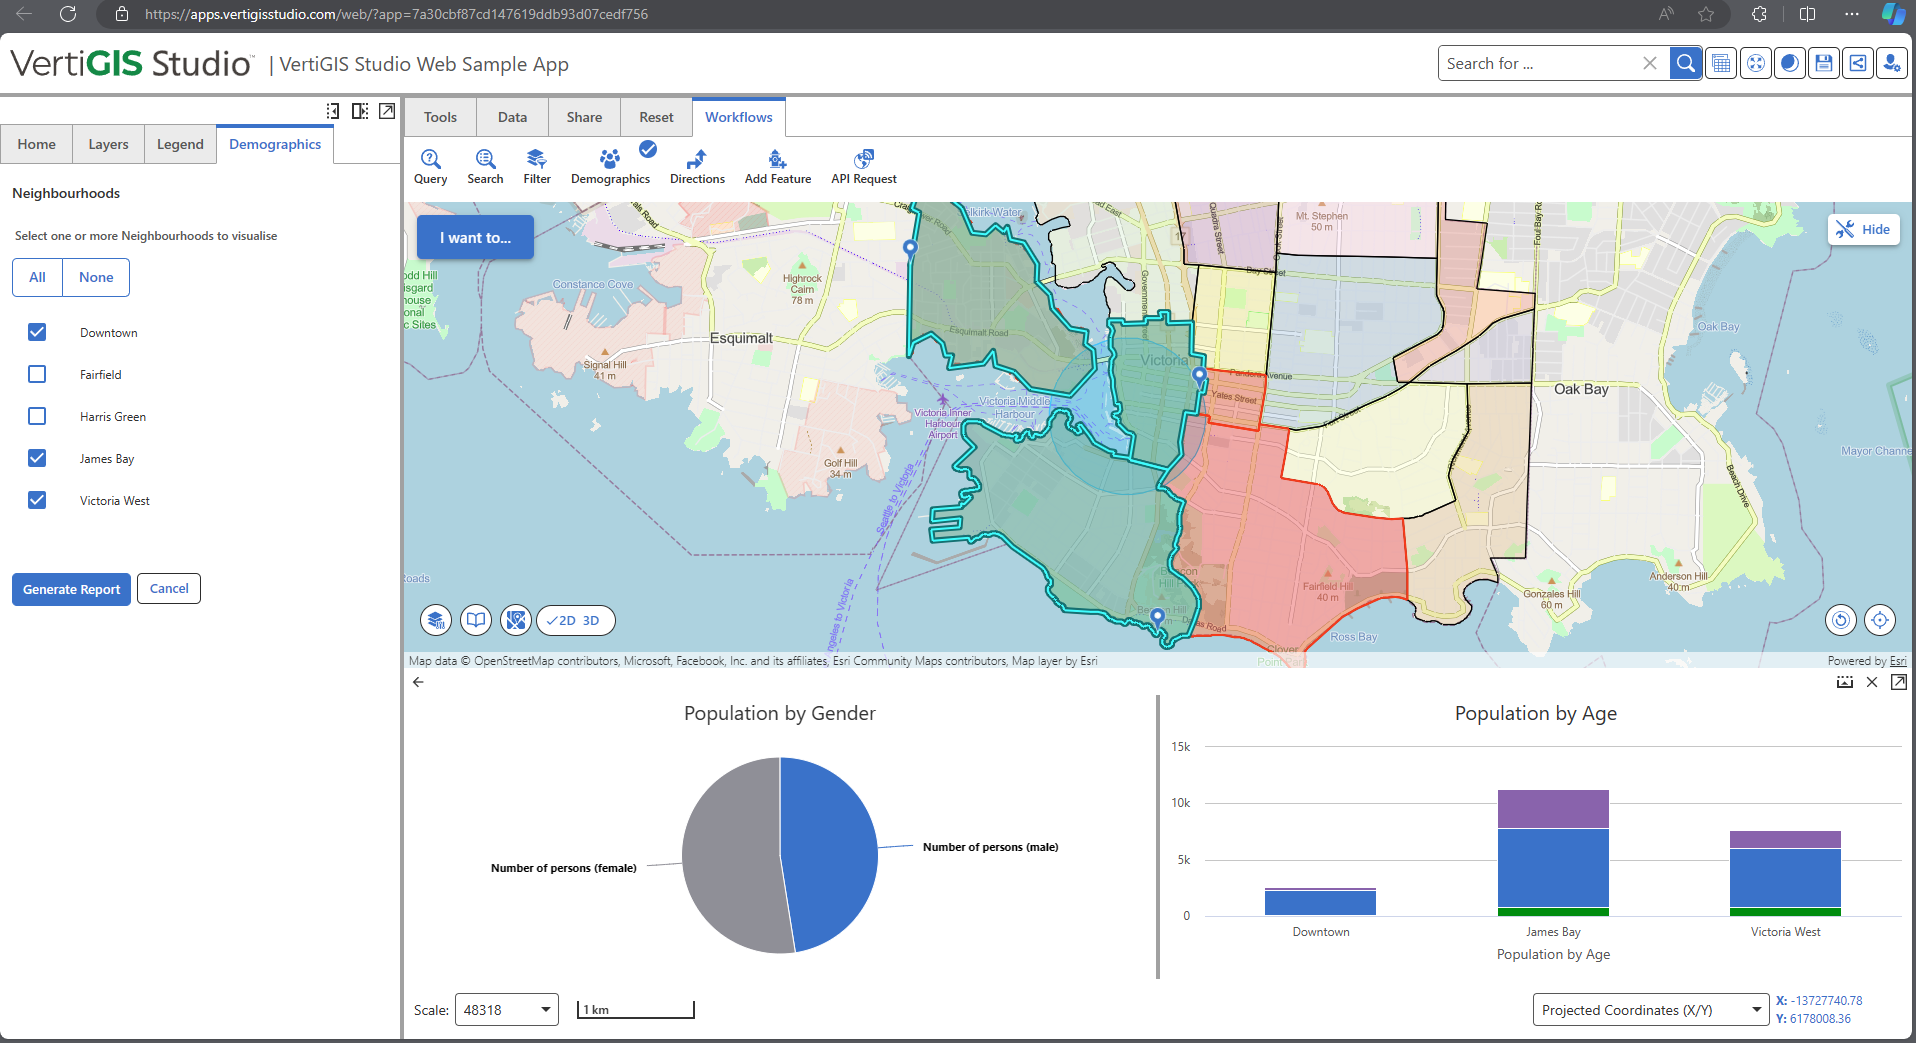
To answer your question around what syntax and structure to use for that results.from-graphics - it's expecting an Esri graphic object so an example of valid input would be={graphics: $selectedFeatures.result}
For context have a look at the workflow's display form inside the change event on the Item Picker. This is where we're doing all our work with the features selected, getting VertiGIS Features and populating and activating our form. Looks like this:
Anecdotally, I found charting confusing at first. We only briefly mention in docs that you need VertiGIS Features for charting so your confusion is quite understandable. Hope this helps!2 -
Hi @... and Patrick Fingler,
thank you so much for your help! The examples have been very helpful and it works now :-)
3
Vous devez vous connecter pour laisser un commentaire.
Commentaires
4 commentaires