Is it possible to create charts from input parameter values?
I have a workflow that passes multiple parameter values to a report.
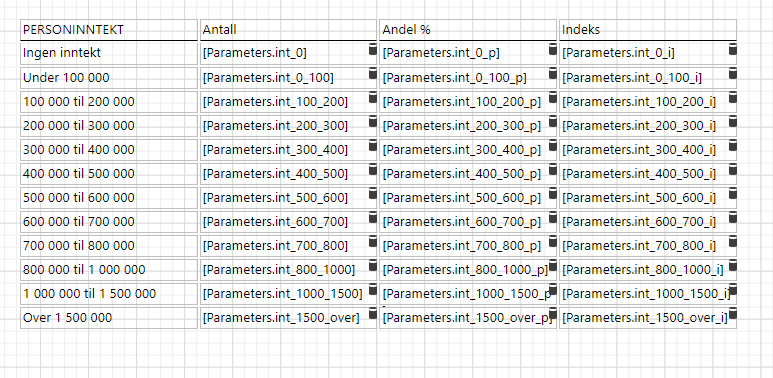
These parameters are displayed in tables in the Details pane, but I would also like to create bar charts for the same data. Is this possible? When opening the designer for charts, the Series Data Member is greyed out because it only supports data from a database or service..
Is there a way to use data from tables in the report it self?
-

Hi @Kristine Smaadal?, one workaround that I have found is to create a calculated field on your data source which takes each parameter as input. Calculated fields can be referenced in the Argument and Value sections inside of Geocortex Reporting charts
0 -
Thank you for helping out, @Patrick Fingler? ! This was good news :)
0
Vous devez vous connecter pour laisser un commentaire.
Commentaires
2 commentaires