Pic chart not affected by "Group Fields" value

Hi,
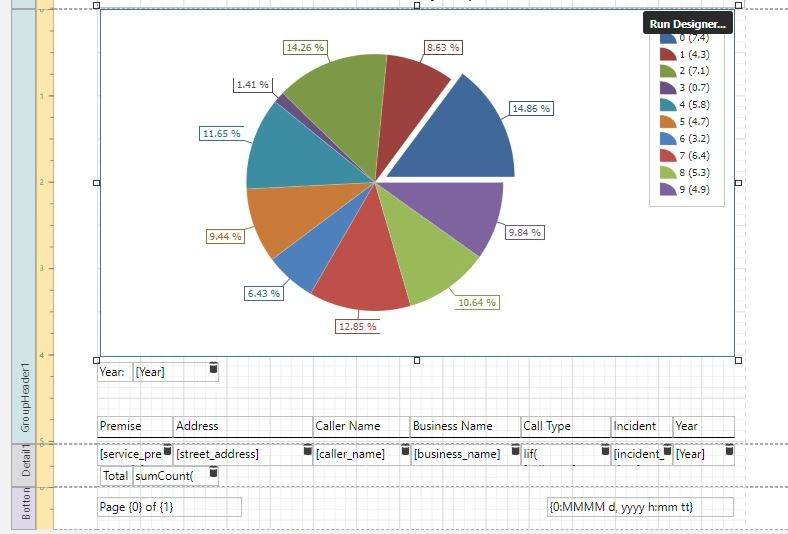
I have a Group Header that is grouped according to a calculated field (GetYear([incident_date])). In this header, I have a pie chart which I would like to display incident type counts for each year. Associated details and sums within this group seem to adhere to the group by value, but the chart only wants to display values for all years not for each year in the dataset. Seems like this should be an easy fix, but I've been stuck for quite a while now.
Thanks in advance for any assistance.
Cheers,
Peter
-

Hi Peter,
I've attached an example output that might help. In my example, I'm using a Projects layer that has a CATEGORY attribute that I am using to group by, and a YEAR attribute that I'm using as my argument in my chart.
One tip is that you can send a parameter to a chart and use it in the Filter String parameter. In my example, I'm passing a parameter called category to my chart and included it in my Filter String to group the chart for each category.
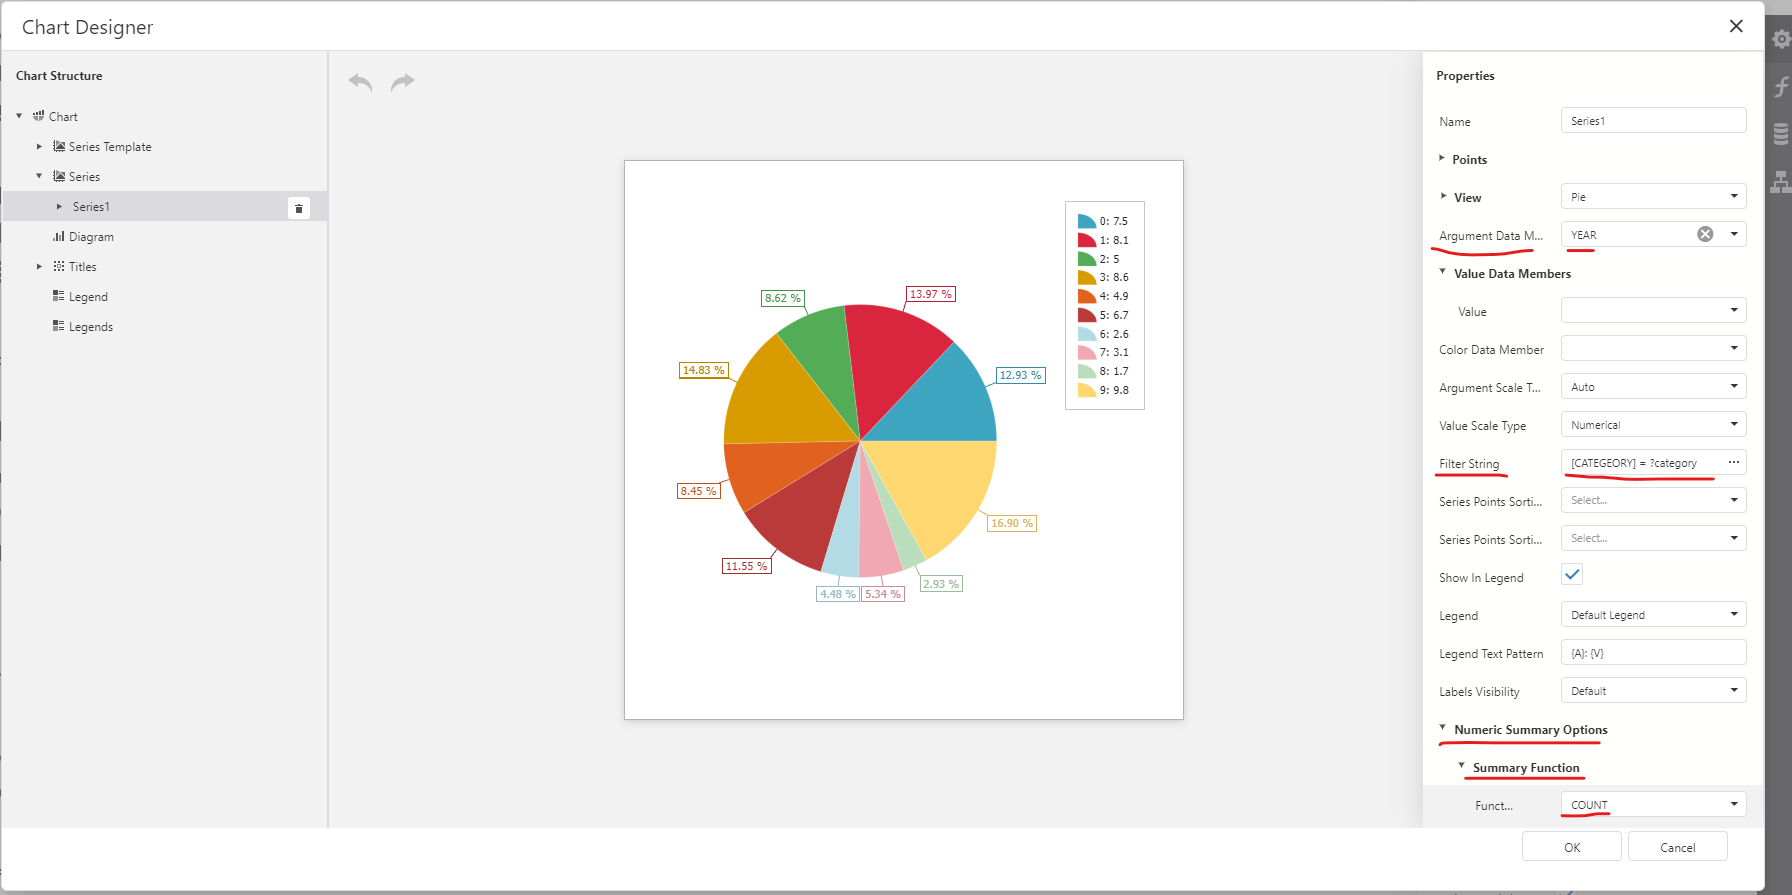 You can see where the parameter is defined below:
Lastly, I've also included the following in my Group Header.
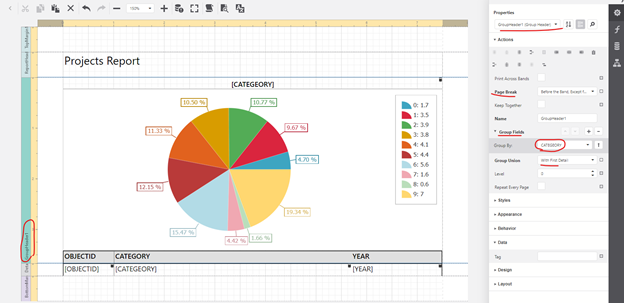
Is this similar to what you are trying to accomplish?
0 -
Hi Patrick,
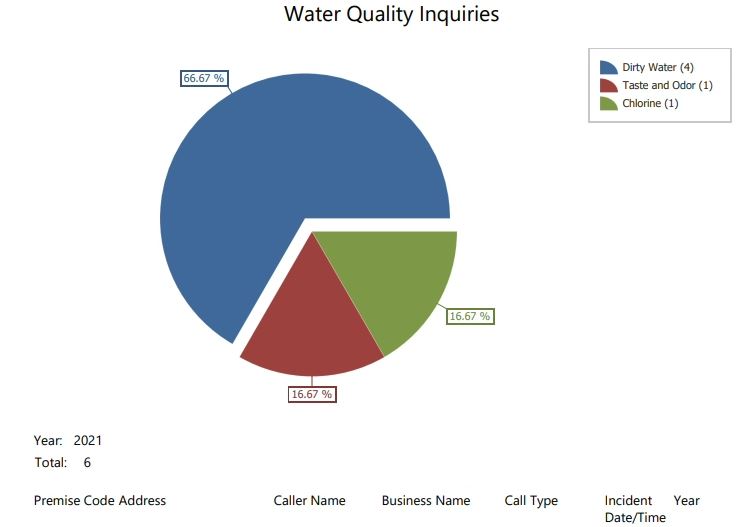
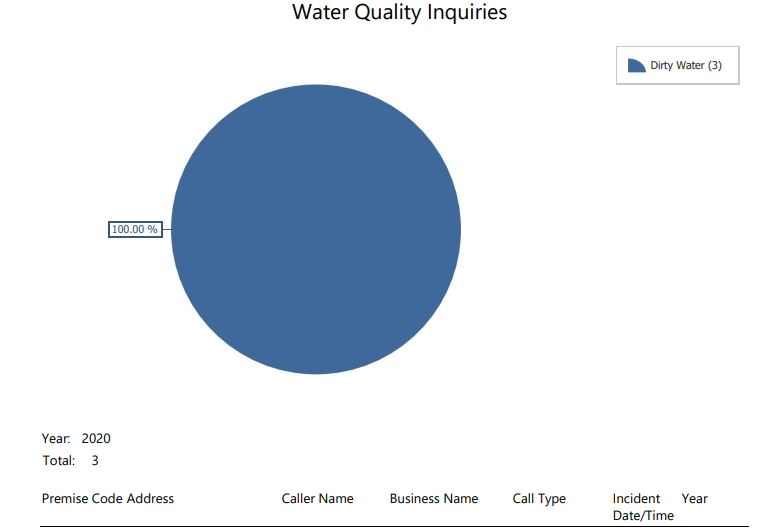
Thanks so much for your response! That worked great! My use case was slightly different (passing a year parameter rather than a category parameter, category as argument), but just flipping the values from your example gave me exactly what I needed. I attached some screen captures of the chart at the top of each page of the report for others to reference (the grouped details are cut off due to PII).
Really appreciate you taking the time to respond to this.
-Peter
0 -
Happy help out. Good to see you were able to get it to work!
0
Vous devez vous connecter pour laisser un commentaire.
Commentaires
3 commentaires