Dynamic charts based on related data
I am designing a report that extracts data from the wells features in wells map service. I want to add a dynamic chart inside the report that is drawn based on data related to each well:
The wells features have unique code stored in Well_ID field, and I want to draw a dynamic chart for any well based on data in another table which contains Well readings like PH that also contains Well_ID field.
The feature layer is linked to readings table using the Well_ID field.
When building a chart, in the data source configuration, I could write an SQL query that takes data from the readings table. However, I am not able to calibrate it so it takes Well_ID from features.
The SQL query is like this
"Select PH_Reading from dbo.A.Well_Readings”
This query returns the data for all wells, and I am not able to set a Where clause that queries data for only the targeted well based on Well_ID for example by adding the following clause:
“Where Well_ID =ID_Parameter”
Where the ID_Parameter equals Well_ID, and automatically used by the report for the targeted well
Is there a way to do this?
Any help is highly appreciated
Kind Regards,
Hani
0
-

I'm not sure that I follow you, apologies. Are you asking for a way to make a chart in a report (rpx) or in the viewer? And is your central issue that you can't append a where clause to your query? I would wonder why you can't append the where clause, are you getting some error? 0 -

Dear Zack,
Thank you for your interest,
What I am looking for is drawing the chart for layer data based on the data extracted from related table, the following example better elaborates my case:
I have wells layer with unique IDs stored in Well_ID field, In addition to this layer, I have a table for wells PH readings, in which many PH readings are stored for each well and the well in this table is also identified by Well_ID field
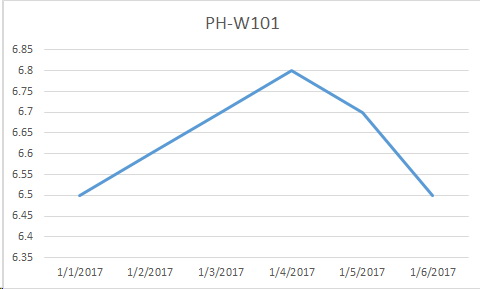
I want to design a report (rpx) that will be installed on wells layer, such that when it is run on a specific well (e.g. with ID W101) it queries the data from the readings table for W101 well, and based on this data the chart is drawn as shown in the screenshots below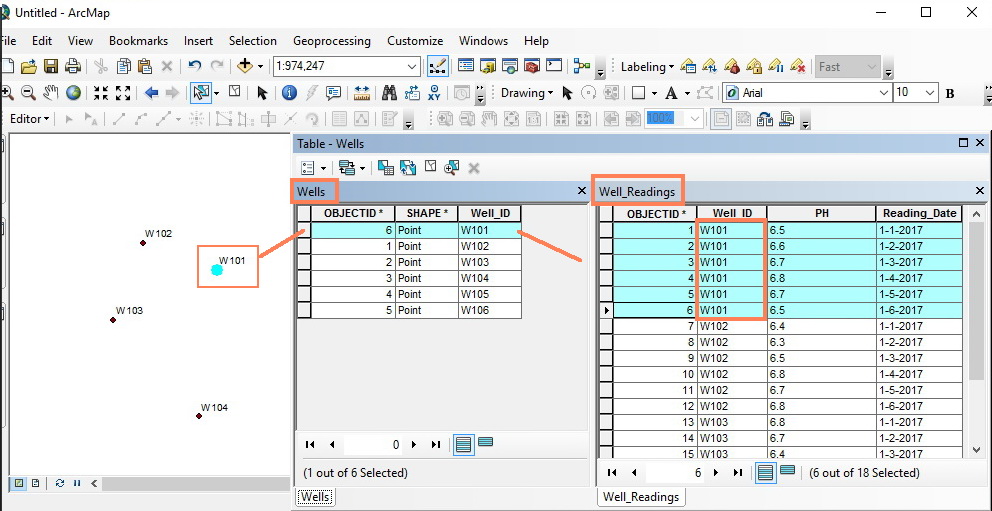
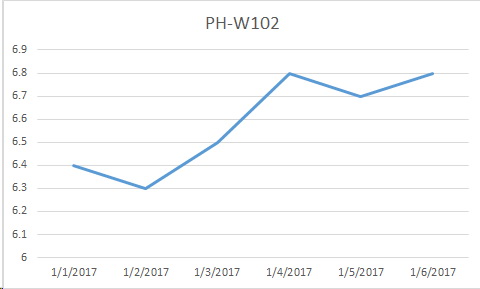
When the report is run for W102 well, the report should query the data for W102 from the readings table and draw the PH chart based on it as in the following screenshots, and the same can be done for any well that report is run for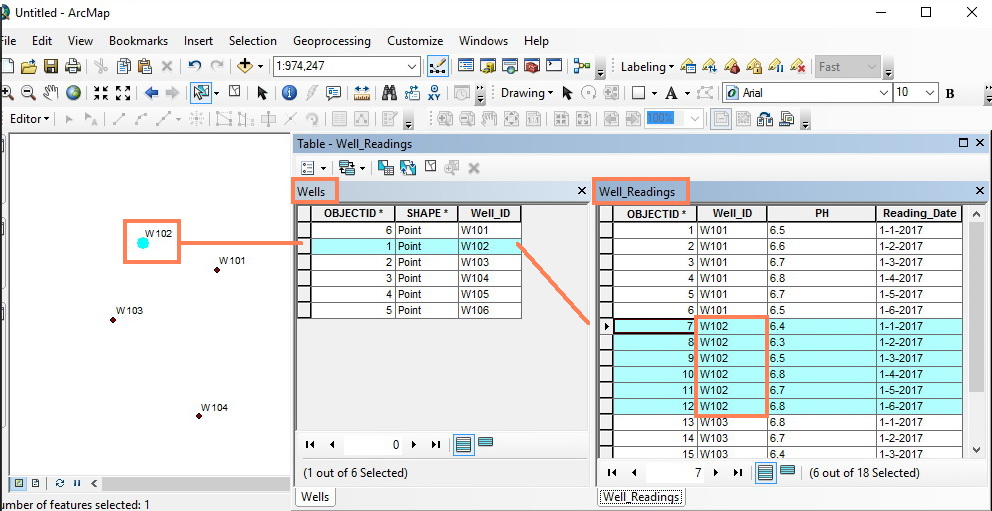
My question is how to define such query in datasource section, that queries data from readings table based on the selected Well ID in the layer
Kind Regards,
Hani0
Please sign in to leave a comment.
Comments
2 comments