How do I activate charting view?

I have seen pictures and descriptions of theis mythical 'Charting View' but I can't for the life of me figure out how to activate it. The only way I can view charts are thorugh reports, or in the 'View Additional Details', as shown in the below example. How do I open charting view to show that chart in a larger window? I've tried the Command ShowChartingView and DisplayChartById, but niether do anything.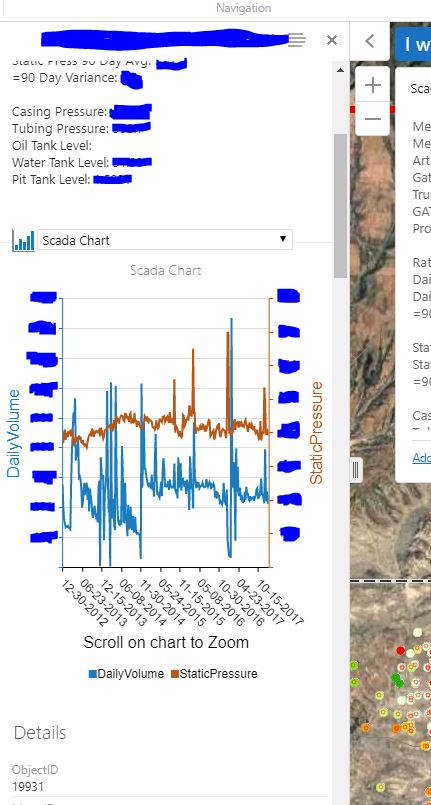
0
-

Max,
Have you added the View Charts tool to your toolbar?
https://maps.srcity.org/Html5Viewer/Index.html?viewer=OpenDataViewer0 -
Seem like a good first step doesn't it... I just added it but it's greyed out. It looks like it uses the same Command 'ShowChartingView' as I've tried to use before as a menu item in map tips, but nothing happens. 0 -
It is grayed out until something gets selected - see my example 0 -
Yeah, I saw in your map that when I clicked on something that it activated, then shows the chart when selected. If I click on or use the Identify tool in my map to select the point on the map and aven add it to results, the View Charts tool still stays greyed out, 0 -
I'm stumped. The chart is set to visible I assume..and set to run off of the layer that you can identify.. 0 -
Hi Max,
I believe the charting view is only available for charts that are set to use Multiple Features. Single Feature charts will only appear in the Feature Details view (or a report).
0 -

Hi Max,
Cory makes a good point - Single Feature charts will not activate the "View Charts" button. There is another way to get there for a Single Feature chart though. From where you are at your screenshot above:
1. Click the hamburger menu icon, select Show Expanded View: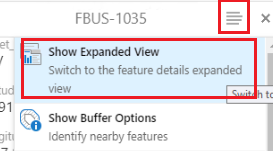
2. Open the Charts tab: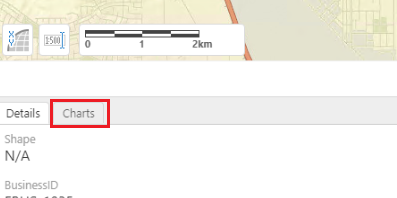
3. Maximize the panel to get it to take up the full pane: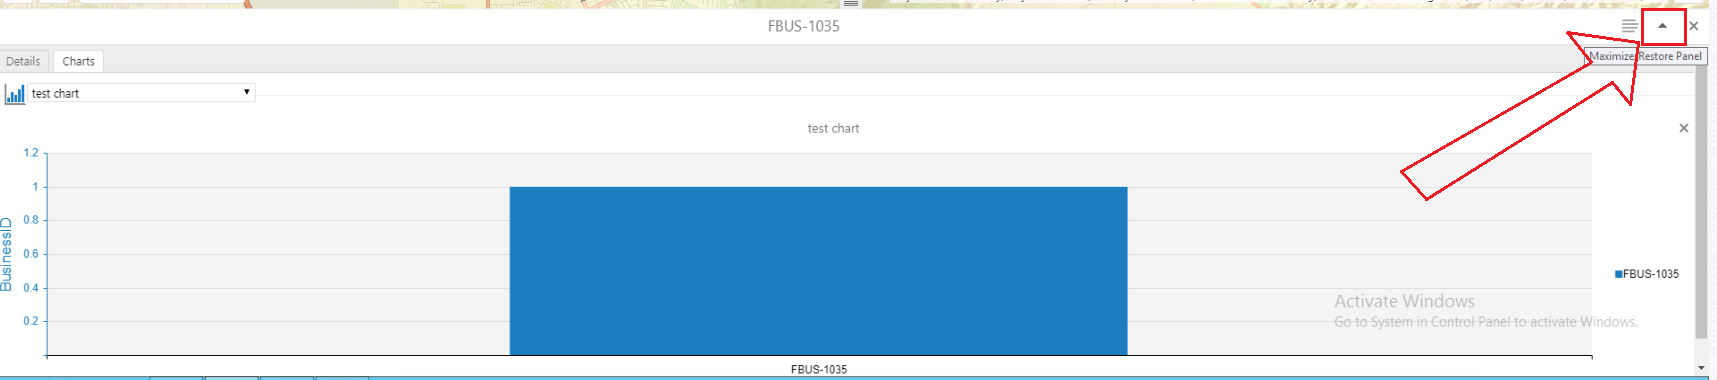 0
0 -
So appearently I want a mix of the featues single feature and multi feature charts provide. Ideally I would like the user to be able to click a 'Chart Button' that sits next to 'view additonal details' in the map tip box, and when they do that the Chart view opens on the bottom of the viewer with that chart, while still leaving the layer list open on the left panel.
At the moment if I use single feature charts and they use 'show expanded view', they loose their layer list and everythng shows in expanded view, witch is more clicks and is confusing for them. If I use multi feature charts I get the seperate chart view and layer list, but they need to use the identify tool select the feature, then click on the the identified result and then open the cart, which is again, confusing and slow, plus they may start charting multple features which shouldn't be combined inthis case.
You guys have definately been a big help and at least there are options now, Charting has just been a pain since the beginning.0 -

I recently did an upgrade from 4.5 to 4.11 essentials and this also caused me an issue. The View Charts button just wouldnt work from the toolbar. It appears as now you have to make the selection onscreen then in the Panel Actions Menu click on Charting View which brings it up. 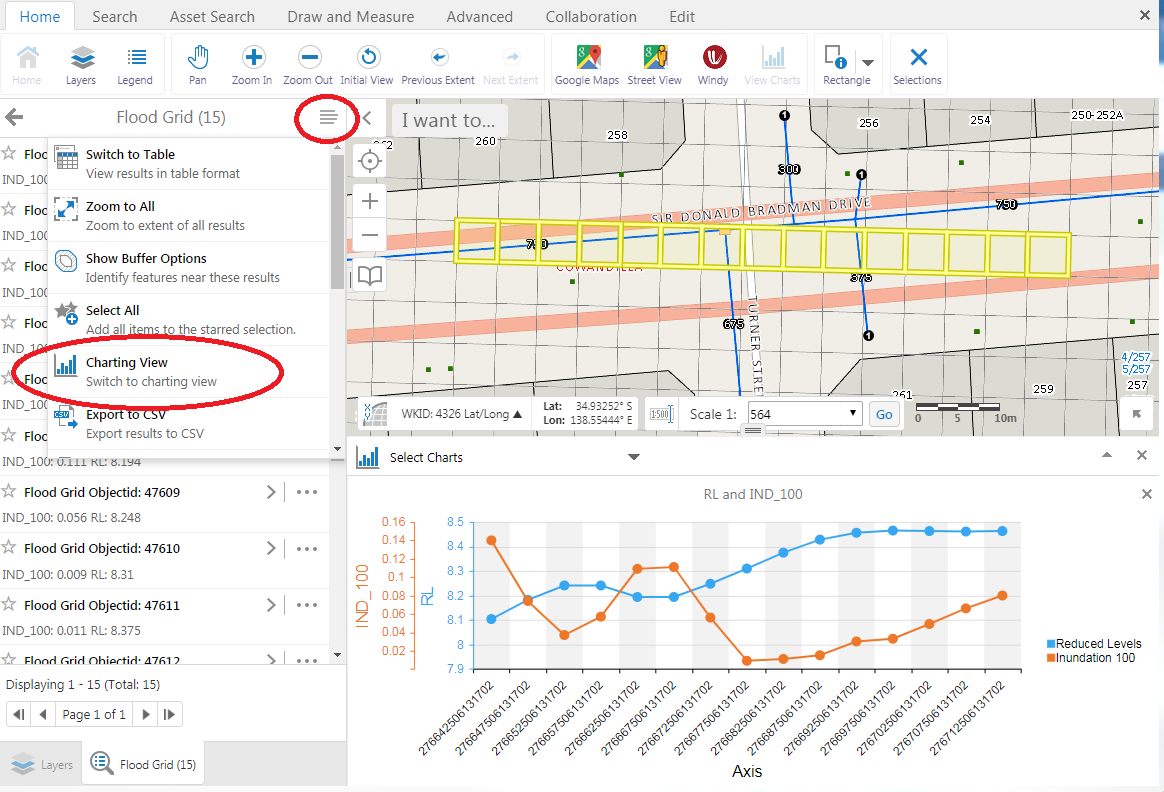 0
0
Please sign in to leave a comment.
Comments
9 comments