Identify Tool returning less than optimal results.

Hi All,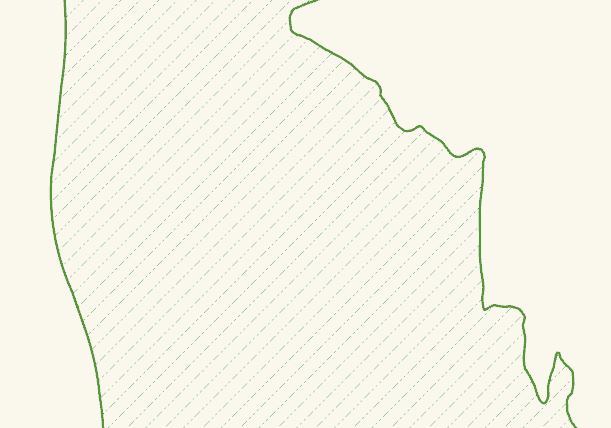
It was recently brought to my attention by a confused and concerned end-user that the identify tool in our public web map is returning some weird results. Basically, as far as I can tell, when a user selects the identify tool and clicks on a polygon feature - if that feature has a somewhat complex geometry (ie. follows a coast line) then the "feature selection" that is returned has a really weird geometry.
I'm very new to the world of Geocortex, so I'm curious if there is a maximum number of feature vertices that are returned when using this tool, and as a result the application is drawing the selected feature with dropped vertices. If this seems logical is there a way to increase the complexity of the feature that is returned when using the tool.
I've included some screenshots below to try to better describe the issue.
This is the area to be selected using the identify tool:
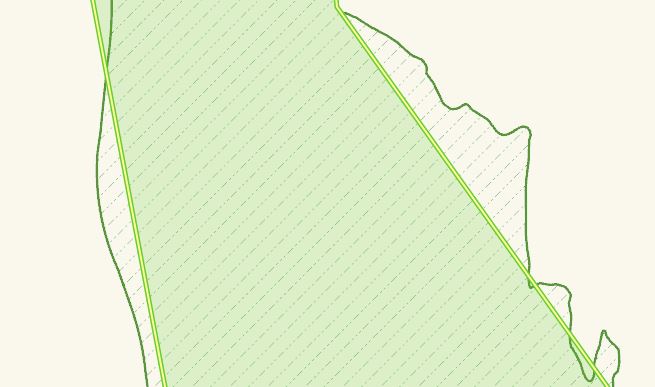
This is what is returned...
Thanks for your insight!
Chris
0
-

Hi Chris,
You can try updating the vertices limit in the viewer config file but depending on the complexity of the geometry, it may not help.
The viewer config file is the Desktop.json.js file and the setting in this file will be in the "Highlight" module and look like this -
"thresholdVertices": 10000,
Try setting it to 20000 or 30000.
Regards,Wayne
C:\Program Files (x86)\Latitude Geographics\Geocortex Essentials\Default\REST Elements\Sites\SITENAME\Viewers\VIEWERNAME\VirtualDirectory\Resources\Config\Default\Desktop.json.js0 -
Awesome, thanks for the reply Wayne. I'll give that a try. 0 -
That worked out perfectly. I also had to increase "maxHighlightableGeometryVertices" to match the "thresholdVertices" or it threw and error.
Thanks again!0
Please sign in to leave a comment.
Comments
3 comments