Changing color of a shape based on record properties
I have a web map that shows all permitted food facilities in the county and allows users to download a report of the three most recent inspections for any given facility.
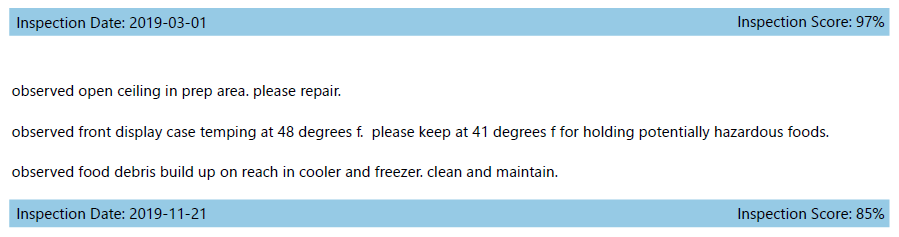
This report includes a subreport that shows the date, score, and details for each inspection record.
What I would really love to do is to change the color of the rectangle at the top of the subreport based on the score (blue for 90-100%, green for 80-89%, yellow for 70-79%, red for <70%).
Does anyone have any ideas on how to do this, if it's possible?
Thanks,
Denise
-

Hi @Denise Beckham?,
This can be accomplished in GR5. My following example is close to your use case. I color the arrows based on the value of the object id field on the far left:
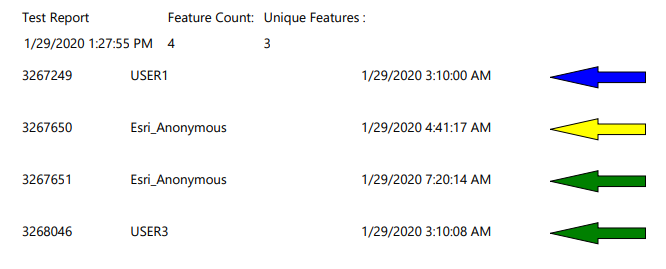
Arrows for objectids less than 3267250 are blue, objectids over 3267249 and less than 3267651 are yellow, and all others are green.
I added the expression for the fill color by clicking the shape, clicking the expressions button, then setting the Fill Color property.
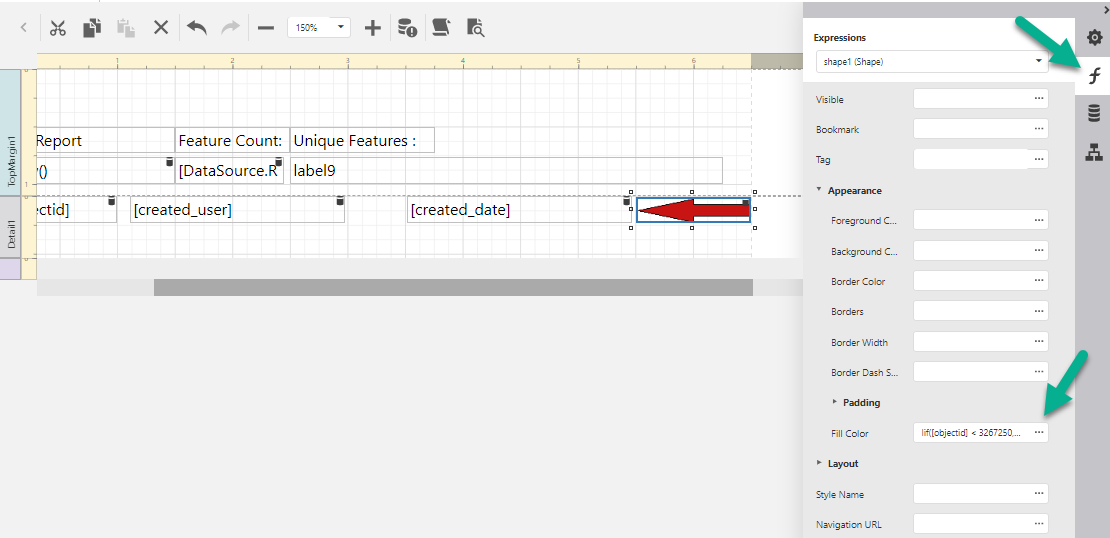
This is the expression I used:
Iif([objectid] < 3267250, 'Blue', Iif([objectid] < 3267651 , 'Yellow', 'Green') )You would want something like:
Iif([score] < 70, 'Red', Iif([score] < 80 , 'Green', 'Yellow') )Edit: Added an image
0 -

Excellent! I somehow hadn't noticed "Appearance" in the expressions tab.
After playing around with the color picker (and Googling how to adjust transparency in hex values [Apparently the two values that control transparency go in front of the six values for color in this case.]), I ended up using the following expression:
Iif( [score] >= 90, '#66007fbf', [score] < 90 AND [score] >= 80, '#661f9404', [score] < 80 AND [score] >= 70, '#80d3de00', '#66b80000')
Thank you for your help, Peter!
0
Please sign in to leave a comment.
Comments
2 comments