Plot and Manage Coordinates/Notes/Drawings like in Geocortex Essentials
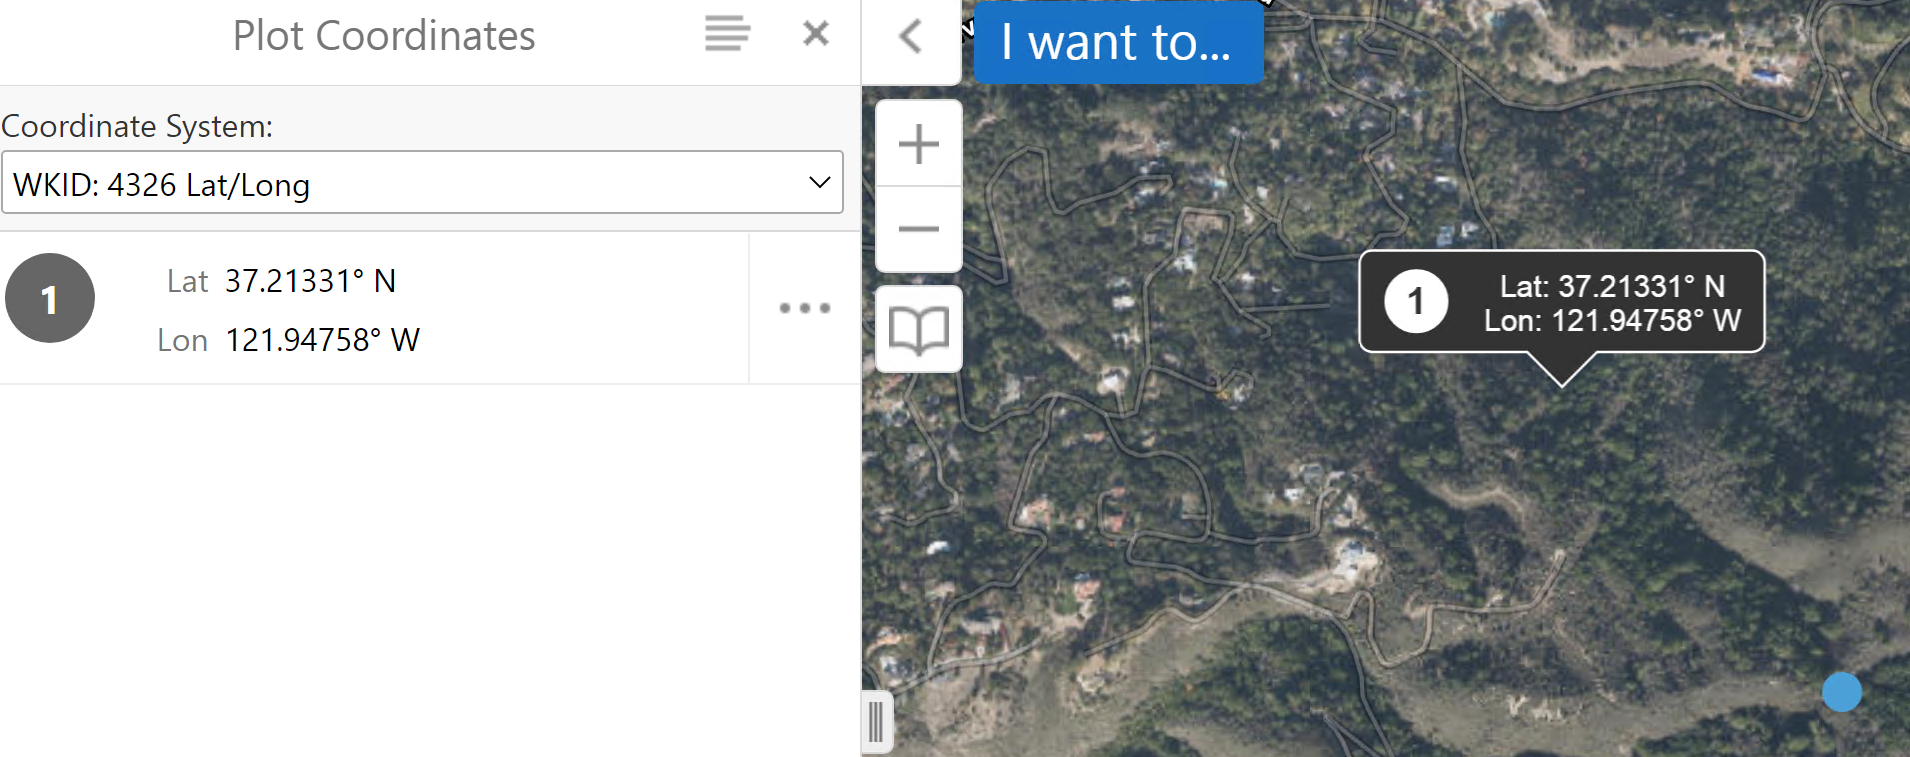
I am wondering if there is a way in VSW to recreate the functionality available in Geocortex Essentials shown in the images below. In GXE, after plotting coordinates (Map Notes in VSW) or graphics, you can left-click on them to show them in a side panel or popup, almost as if they're considered identifiable features, like those from a Feature/Map Service.
I can somewhat recreate this in VSW, but I think it's not as streamlined as it could be.
In my VSW app, I have my map context menu set to enable user to add map notes/coordinates, as well as draw point markup. However, currently, the only way I know to enable users to then interact with and delete them is to add two more context menu actions, one to select coordinates/notes so they can hit the delete key, and another to select point markup, so again they can hit the delete key. I've found no way to combine them into a single button. Map notes and markup are both stored in collections, but when providing arguments for map.get-markup, the collection parameter is a string. It would be nice if I could provide an array of collections, so whichever is intersected, the graphics from the intersected markup collection would be selected.

Bitte melden Sie sich an, um einen Kommentar zu hinterlassen.
Kommentare
0 Kommentare