Add "Grouped Results" events (To hide highlights when results are grouped)
If possible, it would be great to have an additional event on the Results List component that allows you to configure logic when the Results Grouping setting is enabled (Ex: Results Grouped Shown/Toggled, Results Grouped On-Hover etc).
Ex: Here is how VSW highlights grouped results by default (I'd prefer if it didn't highlight features when the results are grouped / more than one layer is in the grouped results list) 
For reference, Geocortex Essentials does not highlight records on the map when features are in a grouped state. Only when drilling into the grouped results will it highlight those records.
Ex: No highlights with grouped results (preferred behaviour for VSW)
Ex: Highlights added when drilling into grouped results:
It would be great if we could recreate that same functionality as I find the highlighting/pop-ups to be slightly sluggish in VSW (Compared to GE where it tends to be more performant), especially when highlighting multiple different types of features across different layers/geometry types.
Currently, I don't think there is a way to accomplish this, but if there are any workarounds (or ways to improve the performance of highlighting in general), that would be great! I'm aware of the Vertex Threshold option, but open to any other tips if there are any.
Thanks!
-- Patrick
-

I would also like to be able to disable highlighting when results are grouped. Users complain the screen is illegible when everything is highlighted immediately, but I can't make layers un-identifiable because some people will need to identify those features. They liked how it worked in the old viewer.
1 -

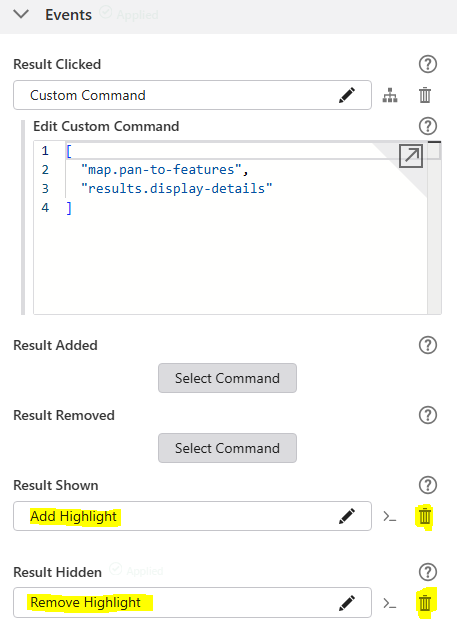
You can remove the highlights when the results are grouped under the results list.
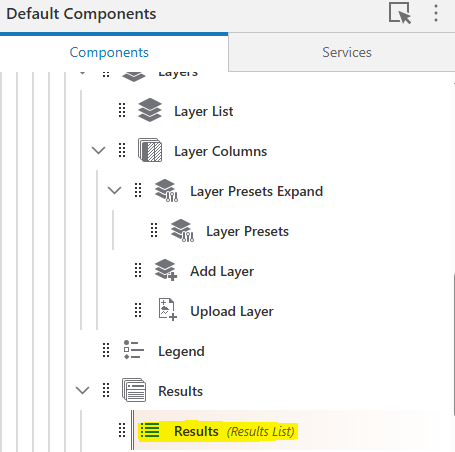
Scroll down to events, then expand them. Find Add Highlight under Results Shown and click the delete button next to the command. Delete the Remove Highlight under Results Hidden event.
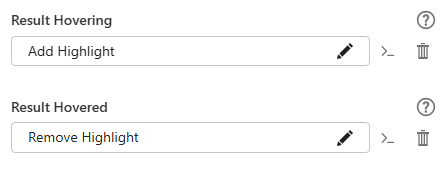
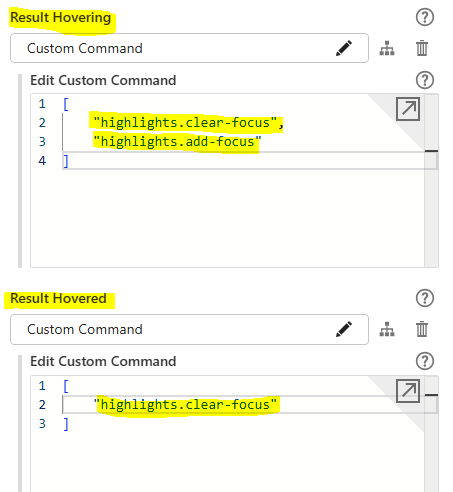
You might want to make the highlights appear when you hover over the results instead. To do this add the highlight commands to the results Hovering and Hovered buttons. e.g.
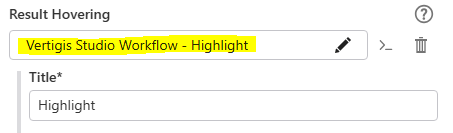
If you want to do something more customised, you can use a workflow in the Result Hovering instead. An example workflow is found below.
{"_properties":{"isServerWorkflow":false},"components":[{"id":1,"steps":[{"id":2,"inputs":{},"position":"0,-10","purpose":"start","title":"Start","transitions":[{"id":45,"inputs":{},"position":"90,50 90,80","sourceConnector":"bottom","target":{"id":42},"targetConnector":"top"}]},{"action":"gcx:wf:core::GetWorkflowInputs","description":"Gets the current selection of features from context.","id":5,"inputs":{},"name":"getWorkflowInputs1","position":"-30,150","title":"Get Workflow Inputs","transitions":[{"id":56,"inputs":{},"position":"90,260 90,300","sourceConnector":"bottom","target":{"id":55},"targetConnector":"top"}]},{"action":"gcx:wf:core:loop:ForEach","description":"Loops through all selected features.","id":7,"inputs":{"items":{"accessors":["$toGraphics"],"annotations":[{"count":11,"index":0,"kind":"idref"}],"code":"$toGraphics.result","source":"$toGraphics.result"}},"name":"forEach1","position":"-30,810","title":"For Each"},{"action":"gcx:wf:arcgis::SymbolFromJson","id":12,"inputs":{"json":{"accessors":[],"annotations":[],"code":"{\n \"type\": \"esriSFS\",\n \"color\": [\n 106,\n 215,\n 251,\n 100\n ],\n \"outline\": {\n \"type\": \"esriSLS\",\n \"color\": [\n 106,\n 215,\n 251,\n 255\n ],\n \"width\": 3,\n \"style\": \"esriSLSSolid\"\n },\n \"style\": \"solid\"\n}","source":"{\n \"type\": \"esriSFS\",\n \"color\": [\n 106,\n 215,\n 251,\n 100\n ],\n \"outline\": {\n \"type\": \"esriSLS\",\n \"color\": [\n 106,\n 215,\n 251,\n 255\n ],\n \"width\": 3,\n \"style\": \"esriSLSSolid\"\n },\n \"style\": \"solid\"\n}"}},"name":"polygon","position":"-30,460","title":"Get Symbol From JSON","transitions":[{"id":39,"inputs":{},"position":"90,520 90,570","target":{"id":38}}]},{"action":"gcx:wf:core::Annotation","description":"This workflow needs to be run from an appropriate location in your Web app, such that the current selection of features can be passed in as context. For example, the Feature Actions menu or the Results List's Results Shown event.\nSee - https://support.vertigis.com/hc/en-us/articles/11875815046930-How-to-Display-Highlighted-Features-from-Studio-Web-in-Prints-and-Reports","id":36,"inputs":{},"position":"-310,90","title":"Notes"},{"action":"gcx:wf:core::Annotation","description":"Symbology JSON can be obtained using Esri's Symbol Builder. Colour, line width, fill type, transparency, etc. are all modifiable by changing the parameters in the JSON.","id":37,"inputs":{},"position":"-310,480","title":"Notes"},{"action":"gcx:wf:arcgis::SymbolFromJson","id":38,"inputs":{"json":{"accessors":[],"annotations":[],"code":"{\n \"type\": \"esriSLS\",\n \"color\": [\n 106,\n 215,\n 251,\n 255\n ],\n \"width\": 3,\n \"style\": \"esriSLSSolid\"\n}","source":"{\n \"type\": \"esriSLS\",\n \"color\": [\n 106,\n 215,\n 251,\n 255\n ],\n \"width\": 3,\n \"style\": \"esriSLSSolid\"\n}"}},"name":"line","position":"-30,570","title":"Get Symbol From JSON","transitions":[{"id":44,"inputs":{},"position":"90,630 90,690","target":{"id":43}}]},{"action":"gcx:wf:arcgis::ClearGraphicsLayer","id":42,"inputs":{"layerId":"my-graphics-flash-layer"},"position":"-30,80","title":"Clear Graphics","transitions":[{"id":46,"position":"90,110 90,150","target":{"id":5}}]},{"action":"gcx:wf:arcgis::SymbolFromJson","id":43,"inputs":{"json":{"accessors":[],"annotations":[],"code":"{\n \"type\": \"esriSMS\",\n \"color\": [\n 106,\n 215,\n 251,\n 0\n ],\n \"angle\": 0,\n \"xoffset\": 0,\n \"yoffset\": 0,\n \"size\": 12,\n \"style\": \"esriSMSCircle\",\n \"outline\": {\n \"type\": \"esriSLS\",\n \"color\": [\n 106,\n 215,\n 251,\n 255\n ],\n \"width\": 3,\n \"style\": \"esriSLSSolid\"\n }\n}","source":"{\n \"type\": \"esriSMS\",\n \"color\": [\n 106,\n 215,\n 251,\n 0\n ],\n \"angle\": 0,\n \"xoffset\": 0,\n \"yoffset\": 0,\n \"size\": 12,\n \"style\": \"esriSMSCircle\",\n \"outline\": {\n \"type\": \"esriSLS\",\n \"color\": [\n 106,\n 215,\n 251,\n 255\n ],\n \"width\": 3,\n \"style\": \"esriSLSSolid\"\n }\n}"}},"name":"point","position":"-30,690","title":"Get Symbol From JSON","transitions":[{"id":40,"inputs":{},"position":"90,750 90,810","sourceConnector":"bottom","target":{"id":7}}]},{"action":"gcx:wf:app::RunOperation","description":"Converts VertiGIS features to Esri graphics.","id":55,"inputs":{"operationName":"results.to-graphics","operationParameter":{"accessors":["$getWorkflowInputs1"],"annotations":[{"count":19,"index":0,"kind":"idref"}],"code":"$getWorkflowInputs1.inputs.context","source":"$getWorkflowInputs1.inputs.context"}},"name":"toGraphics","position":"-30,300","title":"Convert to Esri Graphics","transitions":[{"id":57,"inputs":{},"position":"90,410 90,460","target":{"id":12}}]}]},{"id":8,"steps":[{"id":9,"inputs":{},"position":"0,0","purpose":"start","title":"For Each","transitions":[{"id":59,"inputs":{},"position":"90,60 90,110","sourceConnector":"bottom","target":{"id":58}}]},{"action":"gcx:wf:arcgis::CreateGraphic","id":22,"inputs":{"geometry":{"accessors":["$forEach1"],"annotations":[{"count":9,"index":0,"kind":"idref"}],"code":"$forEach1.item.geometry","source":"$forEach1.item.geometry"},"symbol":{"accessors":["$polygon"],"annotations":[{"count":8,"index":0,"kind":"idref"}],"code":"$polygon.symbol","source":"$polygon.symbol"}},"name":"polygonFeature","position":"-30,370","title":"Create Feature","transitions":[{"id":25,"inputs":{},"position":"90,440 90,490","sourceConnector":"bottom","target":{"id":24}}]},{"action":"gcx:wf:arcgis::AddGraphicsLayerFeatures","id":24,"inputs":{"features":{"accessors":["$polygonFeature"],"annotations":[{"count":15,"index":0,"kind":"idref"}],"code":"$polygonFeature.feature","source":"$polygonFeature.feature"},"layerId":"my-graphics-flash-layer"},"name":"addPolygon","position":"-30,490","title":"Add Graphics"},{"action":"gcx:wf:core::Switch","description":"Sorts based on graphics type. Additional types may need to be added, depending on the types of features present in your app.","id":58,"inputs":{"value":{"accessors":["$forEach1"],"annotations":[{"count":9,"index":0,"kind":"idref"}],"code":"$forEach1.item.geometry.type","source":"$forEach1.item.geometry.type"}},"position":"-30,110","title":"Switch","transitions":[{"id":60,"inputs":{},"position":"90,250 90,370","purpose":"default","target":{"id":22},"title":"polygon"},{"branch":"point","id":64,"inputs":{},"position":"-30,180 -200,180 -200,270","sourceConnector":"left","target":{"id":63},"targetConnector":"top"},{"branch":"polyline","id":69,"inputs":{},"position":"210,180 390,180 390,270","sourceConnector":"right","target":{"id":68},"targetConnector":"top"}]},{"action":"gcx:wf:arcgis::CreateGraphic","id":63,"inputs":{"geometry":{"accessors":["$forEach1"],"annotations":[{"count":9,"index":0,"kind":"idref"}],"code":"$forEach1.item.geometry","source":"$forEach1.item.geometry"},"symbol":{"accessors":["$point"],"annotations":[{"count":6,"index":0,"kind":"idref"}],"code":"$point.symbol","source":"$point.symbol"}},"name":"pointFeature","position":"-320,270","title":"Create Feature","transitions":[{"id":74,"inputs":{},"position":"-200,340 -200,390","sourceConnector":"bottom","target":{"id":73}}]},{"action":"gcx:wf:arcgis::CreateGraphic","id":68,"inputs":{"geometry":{"accessors":["$forEach1"],"annotations":[{"count":9,"index":0,"kind":"idref"}],"code":"$forEach1.item.geometry","source":"$forEach1.item.geometry"},"symbol":{"accessors":["$line"],"annotations":[{"count":5,"index":0,"kind":"idref"}],"code":"$line.symbol","source":"$line.symbol"}},"name":"lineFeature","position":"270,270","title":"Create Feature","transitions":[{"id":78,"inputs":{},"position":"390,340 390,390","sourceConnector":"bottom","target":{"id":77}}]},{"action":"gcx:wf:arcgis::AddGraphicsLayerFeatures","id":73,"inputs":{"features":{"accessors":["$pointFeature"],"annotations":[{"count":13,"index":0,"kind":"idref"}],"code":"$pointFeature.feature","source":"$pointFeature.feature"},"layerId":"my-graphics-flash-layer"},"name":"addPoint","position":"-320,390","title":"Add Graphics"},{"action":"gcx:wf:arcgis::AddGraphicsLayerFeatures","id":77,"inputs":{"features":{"accessors":["$lineFeature"],"annotations":[{"count":12,"index":0,"kind":"idref"}],"code":"$lineFeature.feature","source":"$lineFeature.feature"},"layerId":"my-graphics-flash-layer"},"name":"addLine","position":"270,390","title":"Add Graphics"}]}],"deploymentConfig":{"supportedApps":{"VSW":true}},"designerVersion":"5.50.0+14","licenseInfo":{"licenseUrl":"https://acura.kmc.nsw.gov.au/vertigisstudio/workflow/service/auth/license"},"start":{"id":2},"transitions":[{"branch":"loop","id":10,"inputs":{},"source":{"id":7},"target":{"id":9}}]}Copy and save it as example_highlight.json Import it into the workflow and the select it in Result Hovering.
But my final solution is to use add-focus on the Result Hovering e.g.
["highlights.clear-focus", "highlights.add-focus"]
 0
0 -
Bryan Price you say that your solution will “remove the highlights when the results are grouped under the results list”, but it looks like you're removing them completely except for when you hover over the feature(s), right? We're still hoping that it will highlight all the selected features, but only when you're looking at one layer's worth (when results are grouped by layers), not all the selected features across all of the layers.
0 -
Hi Chelsea,
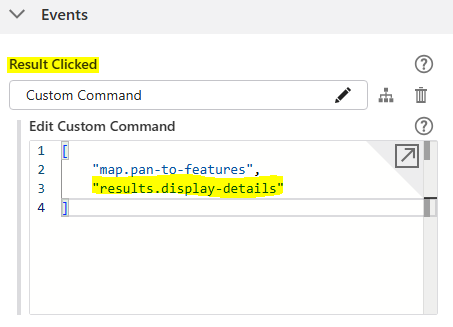
Yes, this is correct they will show up when they are hovered over. I'm pretty sure that “highlighting all the selected features” is what happens by default when you use results clicked → results.display-details ? e.g.
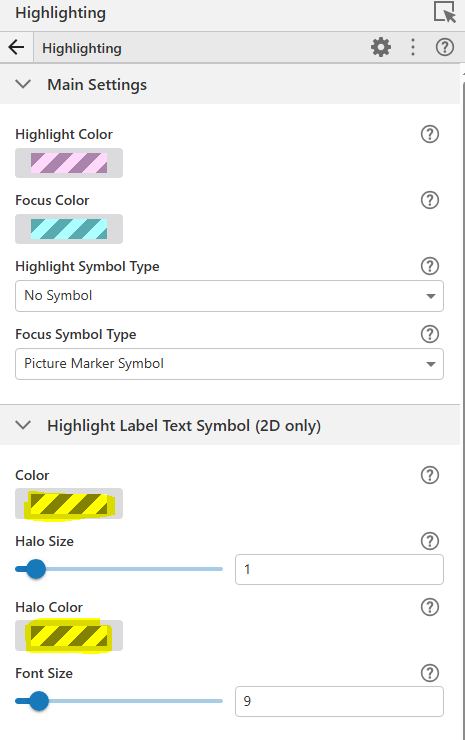
If you don't want the labels to show which can be messy change them to transparent (Alpha = 0) under Services → Highlighting.
 0
0
Bitte melden Sie sich an, um einen Kommentar zu hinterlassen.
Kommentare
4 Kommentare