Report Designer
HI All,
General question - is there some solid documentation out there for Report Designer? I have yet to find any and would like to get my hands on someting to help a newbie get started with it.
Thanks,
Mike
-

Hi Ibrahim,
Setting the CanGrow property to False on the Detail section of the legend subreport will stop the data from being displayed outside of the region you've specified in the print template. However, the subreport isn't aware of the size of the control it is within in the main print template, so it may not start the next column when you expect it to.
To work around this, you can add a bit to your script that will force a new column after a certain number of elements have been printed in one column. I added the following to your script:
/customer/servlet/servlet.FileDownload?file=00P6000000elzHDEAY
With this resulting legend:
/customer/servlet/servlet.FileDownload?file=00P6000000em1MdEAI
You could easily adjust the counter to display more or less elements per column based on the amount of space you have to display the legend.
The settings on my Legend.rpx's Detail section and print template's subreport:
/customer/servlet/servlet.FileDownload?file=00P6000000elzDkEAI /customer/servlet/servlet.FileDownload?file=00P6000000e88LxEAI
0 -
Thanks! it worked like a charm!
Any ideas on how I can add the service names to the legend too by the way?
0 -
Hello Ibrahim & Victoria,
I am actually experiencing the exact opposite problem that Ibrahim described previously. The Legend in my Report Designer is NOT growing to fill it's expanded size parameters in my latest template design even with the "CanGrow" option set to True.
The overall template size is 24" x 36" with a Legend size of 5.625" x 6.688" yet the legend only fills the upper-left most 1.5"-2". The resulting problem is displayed below. Any helpful insight would be very much appreciated.
/customer/servlet/servlet.FileDownload?file=00P6000000em15zEAA
0 -
Hi Madison,
The CanGrow property set to True will mean that if there are more items in the Legend than will fit in the alloted space, the space will "grow" to display all of the items. If you have fewer items in the Legend than will fill the alloted space in the print template, the items themselves will not grow to fill the available space.
If you would like to make the font bigger or adjust the spacing of the items in the legend so that they fill more of the available space in the Legend control, you could use a script such as the one found in the (https://support.geocortex.com/resizeable-legend) code gallery sample here.
-Victoria
0 -
Hi sir,
Do any one know how we can put the name of map services or group layer on the top of layes on print Legend?
Thanks,
Hamid
0 -
Hi Ibrahim,
I want to change the size of Legend in the second rpx file based on the numbe of layer names in Legend.
Do you know how I can get the layer name list and then change the Legend size ?
Thanks,
Hamid
0 -
Jason,
Check out this posting..... it has a sample of a script file you can alter to display a photo in your report:
https://support.geocortex.com/SupportForums/Thread.aspx?pageid=0&mid=2&ItemID=2&thread=51225
Walter
0 -
Hi Hamid,
Did you find a solution to your question?
Sébastien
0 -

+1 on this. Everything else in Geocortex is state of the art, but the Report Designer is way behind in usability and configuration (e.g. being able to set target="_blank" for hyperlinks).
0 -

+1 I second this!
0 -

There is the help file Geocortex Report Designer.chm.
Report Designer is based on Active Reports from GrapeCity (former DataDynamics). You can find documentation here: http://arhelp.grapecity.com/docs/ > ActiveReports 9 User Guide
0 -

Hello Mike,
The Help documentation within the Report Designer should provide a lot of helpful information about using the software and creating your own reports.
Also, take a look at the reports already configured on the Charlotte or LA County sample sites in this directory (by default) (C:\Program Files (x86)\Latitude Geographics\Geocortex Essentials\Default\REST Elements\Sample Sites). The reports are found in this directory (C:\Program Files (x86)\Latitude Geographics\Geocortex Essentials\Default\REST Elements\Sample Sites\LA_County\Resources\TemplateReports).
Thanks, Stefan0 -
Hi
Thanks for that little hint. That was very helpful, good starting point. And the help menu seems pretty decent as well. I thought there would be a PDF document to run through for this. I will have a look at the Grapecity site.
Regards,
Mike
0 -
If you want to have a PDF, you can print the contents of the CHM file to a PDF with a tool like PDFCreator.
0 -
Hi,
In report designer can you add a feature attachment (image files) as an image in the report? If so what do i need to add in the "DataField"?
On that is there a full list of the _mainmap etc text that can be added into the DataField??
Thanks,0 -
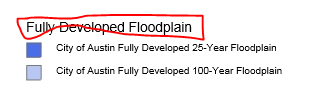
Above is the legend I have. I want to remove the circled text, assuming it is the layer name. However after i remvoed _LayerName, _Layer_Symbol I got error in workflow. I'd like to know if it is possible to do this.
Thanks0
Bitte melden Sie sich an, um einen Kommentar zu hinterlassen.
Kommentare
16 Kommentare