Expandable layer list items in created layer (HTML 5 SDK Viewer extension)
Hello everyone,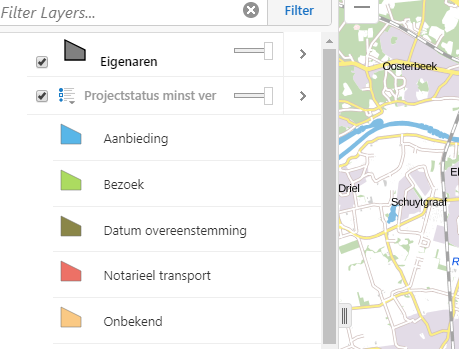
I'm trying to adapt this (https://docs.geocortex.com/essentials/gvh/latest/SamplesViewer/#Create%20and%20Add%20a%20Layer) sample for my own purposes. I'm stuck on getting the item in the layer list to be the proper type. Right now it looks like this, with the top item, "Eigenaren", being my dynamically created list, and the second item, "Projectstatus minst ver" being the type of item that I want it to be.
Here is my (adapted) code for the createMapServiceFromFeatureSet method from the example:
createMapServiceFromFeatureSet(customFeatures: esri.tasks.FeatureSet): Promise<LocalFeatureLayerService> {

        // Create a promise to return
        let promise = new Promise<LocalFeatureLayerService>((resolve, reject) => {
            // Create a Layer Definition. The LayerDefinition object defines the attribute schema and drawing information for a layer drawn using  client-side graphics.
            // This is part of the Esri web map specification. See http://resources.arcgis.com/en/help/arcgis-web-map-json/.
            let layerDefinition: LayerDefinition = {
                name: this._layerName,
                displayField: this._displayFieldName,
                fields: [],
                geometryType: "esriGeometryPolygon",
                objectIdField: this._objectIdFieldName,
                type: "Feature Layer"
            };


            // Add the fields from the featureset
            for (var fieldName in customFeatures.features[0].attributes) {
                if (customFeatures.features[0].attributes.hasOwnProperty(fieldName)) {
                    layerDefinition.fields.push({
                        name: fieldName,
                        type: fieldName === this._objectIdFieldName ? "esriFieldTypeOID" : "esriFieldTypeString",
                        alias: fieldName,
                        editable: false,
                        nullable: true
                    });
                }
            }


            // Create a web map Layer object
            // This object allows overrides on pop-up content and drawing behavior for individual layers of a web service.
            // When used with a feature collection, this object also contains geographic features and their attributes.
            // Part of the Esri web map specification. See http://resources.arcgis.com/en/help/arcgis-web-map-json/.
            let layer: WebMapLayer = {
                featureSet: new esri.tasks.FeatureSet(customFeatures.toJson()),
                id: 0,
                layerDefinition: layerDefinition,
                name: this._layerName,
                title: this._layerName,

            };

            // Now the web map Layer can be used to build a LocalFeatureLayer
            buildLocalFeatureLayerService(layer).then((mapService) => {


                // Configure the geocortex layer
                let gcxLayer: Layer = mapService.layers[0];


                // Add the fields from the layer definition
                for (var i = 0; i < layerDefinition.fields.length; i++) {
                    var field = layerDefinition.fields[i];


                    var fieldInfo = {
                        layer: gcxLayer,
                        dataType: Field.convertFromEsriType(field.type),
                        alias: field.alias,
                        displayName: field.alias || field.name,
                        name: field.name,
                        searchable: true,
                        visible: true,
                        focusField: false,
                        hyperlinkLabel: null
                    };
                    gcxLayer.fields[i] = new Field(fieldInfo);
                }

                // Configure layer properties
                gcxLayer.searchable = true;
                gcxLayer.allowSymbolization = true;

                gcxLayer.type = LayerType.FEATURE_LAYER;
                gcxLayer.showMapTips = true;
                gcxLayer.featureLabel = "{eigenaar}";
                //gcxLayer.featureLongDescription = "<iframe class='custom-maptip' src='{url}'></iframe>";
                gcxLayer.isUserCreated = true;

                // Query is not supported for these layers
                gcxLayer.queryable = false;
                gcxLayer.supportsQuery = false;


                // Attach some default visualizations
                // mapService.heatMap = this._heatMap;
                //mapService.featureClustering = this._cluster;

                // Set the renderer of the feature layer
                // mapService.serviceLayer.setRenderer(new esri.renderer.SimpleRenderer(new esri.symbol.PictureMarkerSymbol(this._iconUri, this._iconSize, this._iconSize)));

                let defaultSymbol = new esri.symbol.SimpleFillSymbol().setStyle(esri.symbol.SimpleFillSymbol.STYLE_SOLID);
                defaultSymbol.outline.setStyle(esri.symbol.SimpleLineSymbol.STYLE_SOLID);
                defaultSymbol.setColor(new esri.Color([128, 128, 128]));
                defaultSymbol.outline.setColor(new esri.Color([255, 255, 255]));

                let renderer = new esri.renderer.UniqueValueRenderer(defaultSymbol, "RHE_ID");


                for (var i = 0; i < customFeatures.features.length; i++) {

                    renderer.addValue(customFeatures.features[i].attributes["RHE_ID"], new esri.symbol.SimpleFillSymbol().setColor(this._rheIdToColor(i)));


                }

                mapService.serviceLayer.setRenderer(renderer);

              console.log(JSON.stringify(gcxLayer.styles));


                // Resolve the promise with the fully configured mapservice
                resolve(mapService);
            });
        });
I'd hoped that using a UniqueValueRenderer here would just magically work, but alas.
Any advice or insight is appreciated.
0
-

Hi,
If you are still struggling with this and want further help then you could open a support ticket but it will likely have to be passed to our Services Team.
Thanks,
Mike Ketler0 -

Hi,
Thanks for your response. Yes I'm still stuck on this... where/how do I open a support ticket? Seriously, I can't find it...0 -
Hi Rik,
At the very top of this page, you should see "Welcome Rik" and an arrow. If you click the arrow a menu will pop-up and you can go to "My Cases".
Regards,
Wayne Richard
Latitude Geographics Group Ltd.
Head Office: 300 – 1117 Wharf Street Victoria, BC Canada V8W 1T7
Tel: (250) 381-8130 | Fax: (250) 381-8132 | wrichard@latitudegeo.com
Developers of Geocortex web-based mapping software | www.geocortex.com
An Esri Platinum Business Partner0 -

Hi Rik,
Did you get an answer from Latitude on this one - I have a similar problem - when I use the UniqueValueRenderer the TOC in not updated. The features in the map look okay, but the TOC is not.
- Jesper0 -
Hi Jesper,
No, not really. I've "solved" this issue by creating something in a different panel myself as an alternative, since w ended up needing some additional functionality on it anyway.
This is what it looks like now:
_img_ alt="User-added image" src="https://latitudegeo--c.na53.content.force.com/servlet/rtaImage?eid=907f2000000XeeD&feoid=Body&refid=0EMf2000000YEKC" _/_img_
If you think something like that would work for you I'd be happy to help you with it if you have any questions.0 -
Hi Rik
Thanks for your input - I will consider a similar approach.
- Jesper0
Bitte melden Sie sich an, um einen Kommentar zu hinterlassen.
Kommentare
6 Kommentare