Why would a Workflow timeout when it's launched and how do you troubleshoot it?
We have a viewer and all of the Workflows within it will randomly timout when you launch the workflow. We have buttons in the I Want To menu and on the toolbars that are used to launch most workflows and we see an alert box show up stating "There was a workflow error running activity: Timeout exceeded." Sometimes this only lasts a few seconds, meaning you can dismiss the alert message, launch the workflow again and it will work just fine. Other times, this issue is systemic where multiple users will get the timeout message and it persists for like 15+ minutes - in which cases it seems the only way to get it functional again is to reset IIS. This sounds to me like the App Pool is not consistently available or responsive to requests - but how do you monitor this? The viewer application (map, toolbars, layer list, etc.) remains responsive all the time in the viewer... it's just when you try to use a workflow.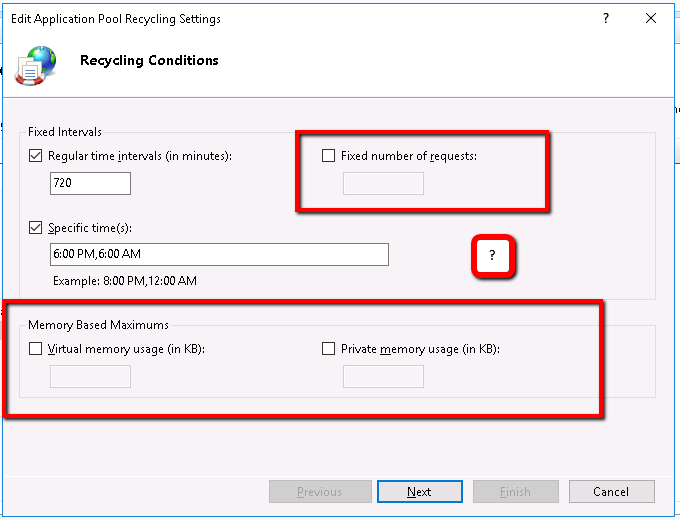
The fact that this only occurs randomly is frustrating because it makes it difficult to diagnose the issue. I've searched all of the System Logs in the Rest\App_Data\logs directory for the word "timeout" but the results don't appear to be related (not seeing the word timeout when the workflows fail to start).
Has Latitude put much thought into the AppPool recycle settings? I see in the "Recycling..." settings for the pool, there are multiple ways to automate restarting the pool... presumably if something is going wrong... too many request or too much memory being consumed. Ours currently show they restart at 6 AM and 6 PM... I don't recall setting this explicitly so I'm wondering if they were configured that way by the Essentials installer???
Mostly I'd just like some guidance on what to watch for. I don't have much to go on and the alert/error message stating the timeout has no information about what's not working.
0
-

Lance, are you running a bunch of workflows? On sites with lots of Workflows and fairly moderate usage, we have run into an issue with how IIS AppPools manage memory pointers. As it was explained to us, the issue stems from each AppPool having a limited amount of memory pointers. Each time you run a site, Workflow, print job, etc., it reserves a memory pointer until the AppPool recycles. On sites with lots of Workflows we seen this issue and usually need to increase the Recycling time like you have done above (from the default of 1440 minutes to 720 or less). This is unfortunately an IIS limitation not necessarily an Essentials issue.
With some clients we've run their recyling as low as every 240 to 360 minutes. The problem with reducing the Recycling this low is that it occurs during business hours. If somebody is running an extended Workflow or Print job and the recycling event occurs, those jobs will crash. We've found running the recycles every six hours with a target recycle at lunch seems to work best for sites that have this issue (e.g. 00:30, 06:30, 12:30, 18:30)
There is no easy fix for this. It requires a lot of testing and tweaking to find a happy medium. I would recommend searching for "AppPool Memory Pointers" and look at how others have worked around Windows memory issues. There is a good response on Server Fault (https://serverfault.com/questions/559022/iis7-5-app-pool-recycles-net-outofmemoryexception) of some other options such as adjusting your Page File, max response size, and lower memory limit.0 -

Hi Lance,
I would agree with Tom, it sounds like you are experiencing GE-7972 (https://support.geocortex.com/essentialsGSCForum?sub-nav=forum&main-nav=essentials&#!/feedtype=SINGLE_QUESTION_DETAIL&criteria=ALLQUESTIONS&id=90660000000PE6BAAW) and by the looks of your current recycling settings, someone has already set them from the default of every 29hrs to twice a day. You may need to increase the frequency again. If possible, look at switching high runner workflows from WF4 to the new WF5.
Regards,
Wayne0 -
Thanks for the feedback! I have modified the schedule to recycle four times over the course of the day... so far no complaints. Ideally I'd like to see the recycle be based on the memory consumption as indicated by the fields at the bottom of my screenshot, but I'm not sure what values to enter there. My thinking is that it would only then recycle the app pool when it's actually needed, rather than the four times I specified as it may not be in "need" of recycling at those times. 0 -
I'm not sure that would help at all, the resource in short supply is "handles" and not memory. The recycling function frees up the number of handles and avoids the issue. Recycling is meant to be harmless to your site so I wouldn't worry about using a setting of 4 times per day.
Regards,Wayne
0 -
Hey Wayne (or others who know) - How do we monitor health of the App Pool? I've never been very clear on how to size the application and we are considering adding additional nodes (4-core VMs) to the implementation - but I'd like to know how the "handles" issue was diagnosed to begin with. In the Windows Performance Monitor application on the servers there are litterally hundreds (if not thousands) of items it can monitor and I'd like something specific to target to "see" the problem.
In our case, we have too many workflows to just convert them all to WF5... so we need to manage the issue at 4 and we want to know what to target. Is adding additional nodes likely to help the issue? It's also a lot of work to go through if it's not likely to fix anything. Any troubleshooting direction would be greatly appreciated.0 -
Lance, you are getting into some voodoo here with IIS. The issue sees to be more with the number of pointers rather than memory and processors. Before you look at additional cores, you may want to look through some of the articles on IIS App Pool Tuning like https://docs.microsoft.com/en-us/biztalk/technical-guides/optimizing-iis-performance (https://docs.microsoft.com/en-us/biztalk/technical-guides/optimizing-iis-performance)
There are a few applications dedicated to monitoring IIS but you might want to go through this article first: https://www.datadoghq.com/blog/iis-metrics/0 -
Thanks for the response Tom - I'll read up on those links.
Basically I just need to know what my options are. The thought behind adding additional VMs to the cluster is based on the principle of balancing our load out among more App Pools... Theory would stand to reason that more App Pools would reduce the burden on all nodes... thus helping them remain stable for longer periods... which inturn means we could increase the time between app pool recycles. Currently we are at a 3 hour interval between recycles on each of our 3 nodes and that seems to have calmed the waters. Previously, we were at an average of about 5 hours between recycles but then we would have App Pools fail. The whole goal in setting up the Performance Monitor on our nodes was a means to watch the stress level of an App Pool in real time... but I don't know what counters in the Performance Monitor track memory "handles" or "pointers" - so I kinda feel like I'm in the dark on the issue. Also, I presume this is how the issue was identified originally - but am not sure and would just like to see.
It seems Latitude's unofficial position on this is to migrate to Workflow 5 (removes the underlying WPF issue from the equation altogether), or to find the right balance in App Pool recycling. I'm just trying to flush out any other potential solutions or stress relief for the App Pools. If the two options above are the extent of what can be done, I'd just like to see that made as an official recommendation / strategy.0 -
Lance, here is a potential solution, we tried this for another client and it sounds (at least we haven't heard of additional issues) since trying.
Go into IIS > Application Pools > EssentialsAppPool4 and open Advanced Options. Change Queue Length from 1000 to 10000.
The Queue Length is the maximum number of requests that will queue up in a specific App Pool. When you fill it up, you get the 503 errors (which is why you are recycling at a higher frequency). You may need to play with the length of the queue.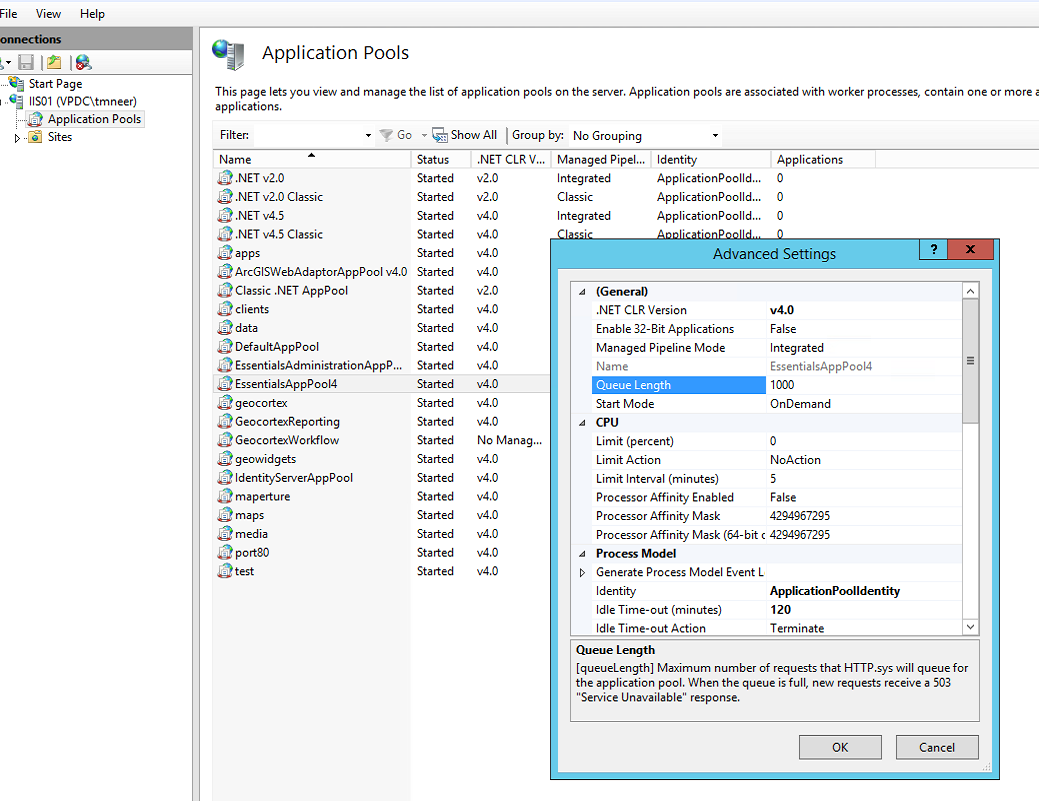 0
0
Bitte melden Sie sich an, um einen Kommentar zu hinterlassen.
Kommentare
8 Kommentare